Datalynx

About Datalynx
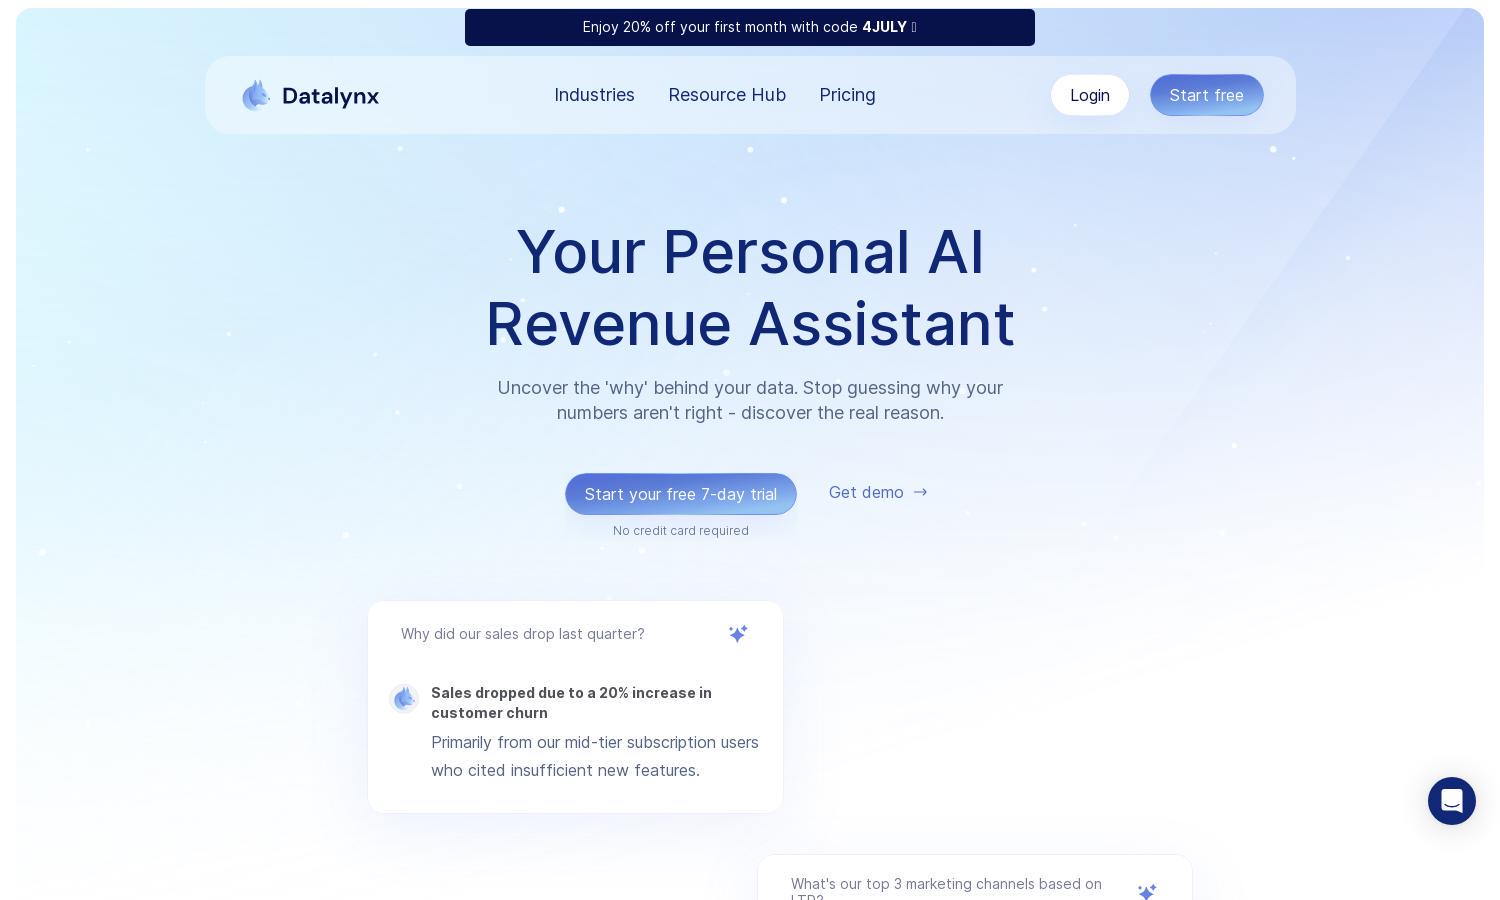
Datalynx is an innovative AI data analyst designed for businesses seeking rapid insights from their data. By connecting databases in minutes and offering no-code SQL query generation, Datalynx empowers users across various industries—like RevOps and Finance—to make informed decisions based on real-time, actionable insights effortlessly.
Datalynx offers a subscription model starting at $39 per month per user, ideal for high-growth teams. With features like unlimited database integrations and assistance, users benefit from exceptional efficiency and enhanced data insights. Customers save 20% with annual billing, maximizing affordability and value while fueling data-driven strategies.
Datalynx's user interface is designed to ensure a seamless experience, combining intuitive navigation with powerful data visualization tools. The layout emphasizes clarity, making it easy for users to connect databases, generate queries, and export results. The user-friendly design enhances productivity, enabling effective data engagement without technical hurdles.
How Datalynx works
Users begin their journey with Datalynx by connecting their SQL databases, which requires only the schema information. Once integrated, users can explain custom fields for higher accuracy before engaging with the platform through a chat interface. They can ask business questions, and Datalynx effortlessly generates SQL queries, providing insights quickly and accurately. This streamlined process ensures efficiency and boosts data-driven decision-making.
Key Features for Datalynx
No-Code SQL Query Generation
Datalynx's no-code SQL query generation empowers users to easily retrieve insights without extensive coding knowledge. Through natural language interactions, users can ask questions, and Datalynx translates them into efficient SQL queries, significantly speeding up the data analysis process and making insights more accessible.
Multi-Step Answer Breakdown
Datalynx offers a unique multi-step answer breakdown, simplifying complex queries into manageable parts. This feature guides users through the data exploration process, allowing them to understand and analyze data effectively, ensuring that insights can be derived without being overwhelmed by layers of complexity.
Data Visualization Charts
Datalynx excels in delivering stunning data visualization charts, transforming raw data into compelling visuals that facilitate understanding and decision-making. This feature allows users to quickly grasp complex data trends and patterns, enhancing their overall analytical experience and driving actionable insights.
You may also like:


