Dividend Data vs GrowPanel

Side-by-side comparison to help you choose the right product.

Integrate real-time stock data and 30+ years of history directly into your Google Sheets or Excel workflow.

Last updated: March 11, 2026

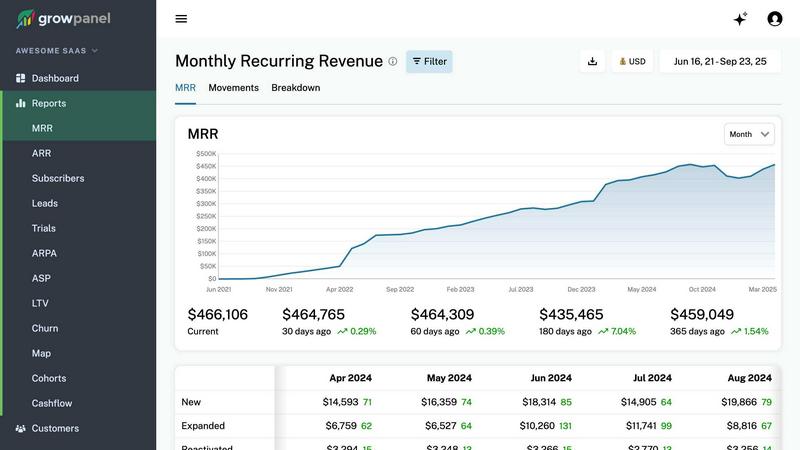
GrowPanel delivers real-time MRR, churn, and LTV analytics for SaaS, seamlessly integrating with major billing.

Last updated: February 27, 2026

Visual Comparison

Dividend Data

Dividend Data screenshot

GrowPanel

GrowPanel screenshot

Feature Comparison

Dividend Data

Native Spreadsheet Integration

Dividend Data operates through dedicated add-ins for both Google Workspace and Microsoft Excel, embedding itself directly into the spreadsheet's function library. This deep integration allows users to call data using simple formulas like =DIVIDENDDATA_QUOTE("MSFT", "price"), creating a live link between the data source and the spreadsheet cell. It requires no external API key management within the sheet, maintaining a clean and secure user workflow. The add-ins are officially listed and rated on the Google Workspace Marketplace and Microsoft AppSource, ensuring compatibility and trust.

Extensive Financial & Dividend Data Library

The platform provides access to a deep historical database covering over 100 key metrics essential for fundamental analysis. This includes forward and historical dividends, ex-dividend dates, dividend growth rates, full financial statements (income, balance sheet, cash flow), earnings per share, and a wide array of profitability, valuation, and liquidity ratios. With 30+ years of data for 80,000+ tickers, users can perform longitudinal analysis and build robust financial models without sourcing data from multiple, disparate providers.

Formula-Driven Automation Engine

At its core, Dividend Data replaces manual data collection with automated formula functions. Users automate their spreadsheets by writing formulas that reference specific tickers and data points. Once set up, these formulas can refresh to pull in the latest data, ensuring that investment dashboards, screening models, and portfolio trackers remain current without any manual intervention. This feature is pivotal for eliminating the "copy-paste" workflow, reducing errors, and saving significant analytical time.

Multi-Platform Product Ecosystem

Beyond the spreadsheet add-ins, Dividend Data offers a complementary web application, the Dividend Data Terminal. This flagship product provides great data visualizations, AI-powered research tools, and automated portfolio tracking, creating a cohesive ecosystem. The spreadsheet add-ins serve as the data pipeline for quantitative modeling, while the Terminal offers enhanced analytical interfaces, demonstrating the platform's commitment to serving different facets of an investor's workflow across multiple compatible platforms.

GrowPanel

Real-time MRR, ARR, Churn, and LTV Tracking

GrowPanel provides real-time tracking of essential financial metrics such as Monthly Recurring Revenue (MRR), Annual Recurring Revenue (ARR), churn, and Customer Lifetime Value (LTV). This feature empowers users to maintain a pulse on their financial health and quickly identify any concerning trends.

Trial Conversion and Cohort Analysis

With the trial conversion and cohort analysis feature, users can delve into customer behaviors during their trial periods. This functionality allows businesses to spot conversion patterns and implement strategies to convert more users into paying customers effectively.

Revenue Segmentation by Plan, Country, or Custom Attributes

GrowPanel enables users to segment their revenue data based on various factors, including subscription plan, geographical location, currency, or any custom attributes. This segmentation is crucial for businesses looking to tailor their marketing efforts and improve customer engagement.

AI Chat for Instant Metric Queries

Leverage GrowPanel's AI chat feature to query your metrics in plain language. This tool allows users to ask questions like "What is our churn rate in Europe this quarter?" and receive instant, understandable answers, eliminating the need for complex data queries.

Use Cases

Dividend Data

Automated Dividend Portfolio Tracking

Investors can build a live dividend portfolio tracker within Excel or Google Sheets. By using formulas to pull current prices, dividend yields, and annual payout data for each holding, they can create a dashboard that automatically calculates total portfolio value, projected annual income, and portfolio-level yield. This automates the monitoring process and provides real-time insight into income generation without manual updating.

Dynamic Stock Screening and Analysis

Fundamental investors can construct custom stock screens using the live data functions. For example, a user can build a sheet that screens for stocks with a dividend yield above 3%, a P/E ratio below 20, and a 5-year positive dividend growth rate. By refreshing the sheet, the screen updates with current data, allowing for the rapid identification of new investment opportunities that meet specific, quantitative criteria.

Historical Financial Model Building

Equity researchers and advanced investors can utilize the 30+ years of historical data to build detailed discounted cash flow (DCF) models or conduct trend analyses. They can pull historical revenue, EPS, and free cash flow directly into their model templates to analyze company performance across business cycles, create financial forecasts, and derive intrinsic value estimates based on deep historical datasets.

Educational and Research Modeling

Students, educators, and individual investors learning security analysis can use the tool to pull real-world data into their study models. Instead of working with static, outdated examples, they can build live models that calculate ratios, chart dividend history, or analyze financial statements for any public company, enhancing the practical learning experience with current market data.

GrowPanel

Enhanced Revenue Tracking for SaaS Companies

SaaS companies can utilize GrowPanel to gain immediate insights into their revenue metrics, allowing them to make data-driven decisions that enhance growth. By tracking MRR, ARR, and churn in real-time, businesses can respond swiftly to any potential issues.

Optimizing Trial Conversion Rates

GrowPanel's trial insights feature allows companies to analyze the behavior of trial users, helping them identify conversion patterns. By understanding how users interact with their product during the trial period, businesses can refine their onboarding processes and increase paying customer conversions.

Effective Cashflow Management

Using GrowPanel's cashflow reporting features, businesses can monitor their revenue, fees, refunds, and taxes in detail. This comprehensive view enables them to make informed financial decisions and ensures nothing slips through the cracks.

AI-Driven Predictive Analytics for Strategic Planning

Businesses can leverage GrowPanel's AI capabilities to uncover trends and gain predictive insights. By asking straightforward questions about their data, teams can quickly identify growth opportunities and make strategic decisions based on real-time analytics.

Overview

About Dividend Data

Dividend Data is a comprehensive financial data integration platform engineered to deliver institutional-grade stock market intelligence directly into the user's native spreadsheet environment. The core product is a suite of add-ins for Google Sheets and Microsoft Excel that eliminates the traditional friction of financial data acquisition. It provides seamless, formula-driven access to over 30 years of historical and real-time data for more than 80,000 global tickers. Designed specifically for dividend and fundamental investors, the system bypasses the need for complex API setups, manual coding, or error-prone copy-paste routines. Users simply employ custom spreadsheet functions, such as =DIVIDENDDATA_DIVIDENDS() or =DIVIDENDDATA_RATIOS(), to pull live data on dividends, yields, payout ratios, financial statements, valuation metrics, and price history directly into their models. Its architecture is built for compatibility and efficiency, offering a generous free tier with 2,500 monthly credits and sub-second average response times. This tech-stack oriented solution empowers investors to build dynamic, automated analysis and portfolio tracking systems within the tools they already use, democratizing access to deep financial data without the prohibitive cost or technical overhead typically associated with professional data feeds.

About GrowPanel

GrowPanel is an innovative subscription analytics platform tailored for SaaS companies seeking clarity and insight into their revenue metrics without the cumbersome chaos of spreadsheets. Designed for businesses that aspire to achieve unprecedented growth, GrowPanel enables users to connect their billing platforms such as Stripe, Chargebee, and Recurly in just one click. Once connected, users gain access to beautiful, real-time dashboards that provide insights into key performance indicators such as Monthly Recurring Revenue (MRR), Annual Recurring Revenue (ARR), churn rates, retention metrics, expansion revenue, and cohort analysis. With a commitment to empowering SaaS businesses, GrowPanel offers a user-friendly experience, making it easy to track financial performance, identify trends, and make informed decisions. Its intuitive design ensures that even those without extensive financial knowledge can navigate and utilize the platform effectively. Additionally, GrowPanel is free until your company reaches $200k ARR, making it an optimal choice for startups and scale-ups focused on sustainable growth.

Frequently Asked Questions

Dividend Data FAQ

How does Dividend Data connect to my spreadsheet?

Dividend Data connects via official add-ins you install from the Google Workspace Marketplace (for Google Sheets) or Microsoft AppSource (for Excel). Once installed, it adds a custom set of functions to your spreadsheet's formula library. You simply type these formulas, like =DIVIDENDDATA_DIVIDENDS("TICKER"), and the add-in handles the data request and population securely in the background, with no coding required.

What is included in the free tier?

The free tier provides 2,500 credits per month that never expire, allowing you to use the spreadsheet functions extensively without a trial period cutoff. This is sufficient for many individual investors to track a portfolio and perform regular analysis. The tier includes access to the core 16+ custom functions for dividends, quotes, ratios, and metrics within the spreadsheet add-ins.

Does it work with both Google Sheets and Microsoft Excel?

Yes, Dividend Data is fully compatible with both major spreadsheet platforms. There is a dedicated Google Sheets add-on and a separate Microsoft Excel add-in. Both offer the same core functionality and formula syntax, allowing you to maintain consistent analysis workflows whether you use Google Workspace or Microsoft 365. The add-ins are independently listed and rated on their respective official stores.

What kind of data history is available?

The platform provides over 30 years of historical market data. This includes historical dividend payments, stock price history, and fundamental financial statement data (annual and quarterly). This deep historical dataset enables long-term trend analysis, backtesting of investment strategies, and the construction of financial models based on extensive historical performance.

GrowPanel FAQ

What billing platforms can I connect with GrowPanel?

GrowPanel seamlessly integrates with a variety of billing platforms, including Stripe, Chargebee, and Recurly. This flexibility allows users to connect their preferred systems quickly and efficiently.

Is GrowPanel compliant with GDPR regulations?

Yes, GrowPanel is EU-hosted and fully compliant with GDPR regulations, ensuring that your data is handled with the highest privacy standards in mind.

How does GrowPanel support mobile users?

GrowPanel is designed with a mobile-first approach, allowing users to access all reports and dashboards on their phones. Users can switch accounts, apply filters, and explore metrics with the same depth as on the desktop version.

Can I try GrowPanel for free?

Absolutely! GrowPanel offers a free trial until your company reaches $200k ARR, making it an ideal choice for startups and growing businesses looking to harness the power of subscription analytics without immediate financial commitment.

Alternatives

Dividend Data Alternatives

Dividend Data is a specialized financial data add-on that delivers institutional-grade dividend and fundamental stock metrics directly into spreadsheet cells. It falls into the category of direct spreadsheet integration tools, designed to bypass complex APIs and manual data entry for investors. Users often explore alternatives for several key reasons. These include budget constraints, where subscription costs may not align with individual needs, or specific feature gaps, such as a requirement for different financial metrics, deeper historical data, or compatibility with other analysis platforms like Python or dedicated portfolio software. The need for a different pricing model, like one-time purchase versus subscription, is also a common driver. When evaluating other solutions, focus on core technical compatibility: does it integrate natively with your primary spreadsheet environment (Google Sheets, Excel, or both)? Assess the depth and breadth of the historical financial data offered, the simplicity of the formula or query syntax, and the transparency of the pricing structure. The ideal tool should fit seamlessly into your existing tech stack and workflow without creating new complexities.

GrowPanel Alternatives

GrowPanel is a subscription analytics platform tailored for SaaS companies, enabling them to gain clear insights into their revenue metrics without the complexities of spreadsheet management. With seamless integration options for billing platforms like Stripe, Chargebee, and Recurly, GrowPanel provides real-time analytics on key performance indicators such as MRR, ARR, churn, and LTV. Users often seek alternatives to GrowPanel for various reasons, including pricing structures, specific feature sets, or compatibility with unique platform requirements. When evaluating alternatives, it is essential to consider factors like real-time data capabilities, ease of integration, user interface, and support for specific analytics needs to ensure the chosen solution aligns with business objectives and growth strategies.

Continue exploring