Dividend Data vs LayoffAlert
Side-by-side comparison to help you choose the right product.
Dividend Data
Integrate real-time stock data and 30+ years of history directly into your Google Sheets or Excel workflow.
Last updated: March 11, 2026
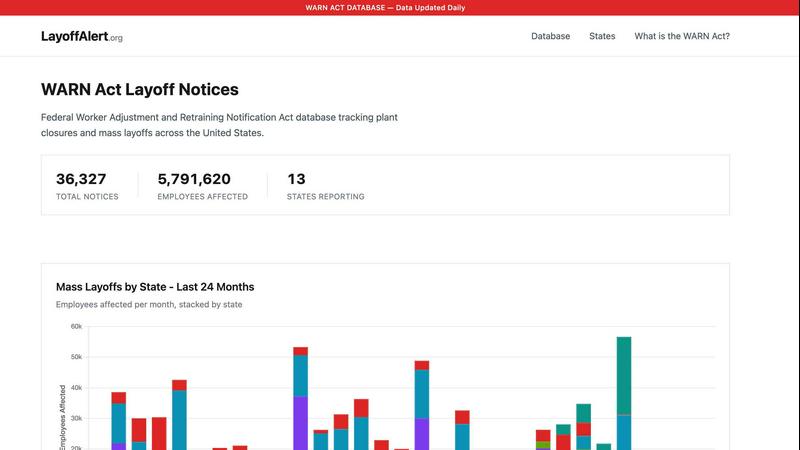
LayoffAlert
Stay informed with LayoffAlert, tracking WARN Act notices to help you prepare for potential layoffs in your company.
Last updated: February 27, 2026
Visual Comparison
Dividend Data

LayoffAlert
Feature Comparison
Dividend Data
Native Spreadsheet Integration
Dividend Data operates through dedicated add-ins for both Google Workspace and Microsoft Excel, embedding itself directly into the spreadsheet's function library. This deep integration allows users to call data using simple formulas like =DIVIDENDDATA_QUOTE("MSFT", "price"), creating a live link between the data source and the spreadsheet cell. It requires no external API key management within the sheet, maintaining a clean and secure user workflow. The add-ins are officially listed and rated on the Google Workspace Marketplace and Microsoft AppSource, ensuring compatibility and trust.
Extensive Financial & Dividend Data Library
The platform provides access to a deep historical database covering over 100 key metrics essential for fundamental analysis. This includes forward and historical dividends, ex-dividend dates, dividend growth rates, full financial statements (income, balance sheet, cash flow), earnings per share, and a wide array of profitability, valuation, and liquidity ratios. With 30+ years of data for 80,000+ tickers, users can perform longitudinal analysis and build robust financial models without sourcing data from multiple, disparate providers.
Formula-Driven Automation Engine
At its core, Dividend Data replaces manual data collection with automated formula functions. Users automate their spreadsheets by writing formulas that reference specific tickers and data points. Once set up, these formulas can refresh to pull in the latest data, ensuring that investment dashboards, screening models, and portfolio trackers remain current without any manual intervention. This feature is pivotal for eliminating the "copy-paste" workflow, reducing errors, and saving significant analytical time.
Multi-Platform Product Ecosystem
Beyond the spreadsheet add-ins, Dividend Data offers a complementary web application, the Dividend Data Terminal. This flagship product provides great data visualizations, AI-powered research tools, and automated portfolio tracking, creating a cohesive ecosystem. The spreadsheet add-ins serve as the data pipeline for quantitative modeling, while the Terminal offers enhanced analytical interfaces, demonstrating the platform's commitment to serving different facets of an investor's workflow across multiple compatible platforms.
LayoffAlert
Comprehensive WARN Act Database
LayoffAlert features an extensive WARN Act database that aggregates notices from 49 states, providing daily updates on filings. This centralized repository allows users to access real-time data about mass layoffs and plant closures across the country.
Customizable Email Alerts
Users can set up personalized email alerts to receive notifications when their tracked companies or regions file new WARN notices. This feature ensures that users are promptly informed about significant changes that may impact their employment status or industry.
Advanced Search Functionality
The platform offers advanced search options where users can filter layoff notices by company name, location, industry, or date. This intuitive functionality enables users to easily locate relevant information that pertains to their specific interests or concerns.
Geographic Layoff Tracking
LayoffAlert provides a geographic overview of layoffs across the United States, visually representing the number of affected employees in each state. This feature allows users to identify trends and patterns in layoffs, making it easier to assess the economic landscape.
Use Cases
Dividend Data
Automated Dividend Portfolio Tracking
Investors can build a live dividend portfolio tracker within Excel or Google Sheets. By using formulas to pull current prices, dividend yields, and annual payout data for each holding, they can create a dashboard that automatically calculates total portfolio value, projected annual income, and portfolio-level yield. This automates the monitoring process and provides real-time insight into income generation without manual updating.
Dynamic Stock Screening and Analysis
Fundamental investors can construct custom stock screens using the live data functions. For example, a user can build a sheet that screens for stocks with a dividend yield above 3%, a P/E ratio below 20, and a 5-year positive dividend growth rate. By refreshing the sheet, the screen updates with current data, allowing for the rapid identification of new investment opportunities that meet specific, quantitative criteria.
Historical Financial Model Building
Equity researchers and advanced investors can utilize the 30+ years of historical data to build detailed discounted cash flow (DCF) models or conduct trend analyses. They can pull historical revenue, EPS, and free cash flow directly into their model templates to analyze company performance across business cycles, create financial forecasts, and derive intrinsic value estimates based on deep historical datasets.
Educational and Research Modeling
Students, educators, and individual investors learning security analysis can use the tool to pull real-world data into their study models. Instead of working with static, outdated examples, they can build live models that calculate ratios, chart dividend history, or analyze financial statements for any public company, enhancing the practical learning experience with current market data.
LayoffAlert
Employee Monitoring
Employees can utilize LayoffAlert to monitor their employers for potential layoffs. By setting up alerts for their company, workers can receive timely notifications about WARN notices, allowing them to prepare for any changes in their job status.
Industry Trend Analysis
Employers, analysts, and researchers can use LayoffAlert to track industry trends and gauge the economic health of specific sectors. By analyzing layoff data, stakeholders can make informed decisions based on current market conditions.
Regional Layoff Awareness
Community organizations and policymakers can leverage LayoffAlert to stay informed about layoffs in their regions. This awareness can aid in addressing local economic challenges and supporting affected workers through targeted initiatives.
Financial and Legal Preparation
Individuals concerned about potential job losses can access LayoffAlert for early warnings, enabling them to seek financial or legal advice proactively. The platform offers recommendations for assistance, helping users navigate challenging employment transitions.
Overview
About Dividend Data
Dividend Data is a comprehensive financial data integration platform engineered to deliver institutional-grade stock market intelligence directly into the user's native spreadsheet environment. The core product is a suite of add-ins for Google Sheets and Microsoft Excel that eliminates the traditional friction of financial data acquisition. It provides seamless, formula-driven access to over 30 years of historical and real-time data for more than 80,000 global tickers. Designed specifically for dividend and fundamental investors, the system bypasses the need for complex API setups, manual coding, or error-prone copy-paste routines. Users simply employ custom spreadsheet functions, such as =DIVIDENDDATA_DIVIDENDS() or =DIVIDENDDATA_RATIOS(), to pull live data on dividends, yields, payout ratios, financial statements, valuation metrics, and price history directly into their models. Its architecture is built for compatibility and efficiency, offering a generous free tier with 2,500 monthly credits and sub-second average response times. This tech-stack oriented solution empowers investors to build dynamic, automated analysis and portfolio tracking systems within the tools they already use, democratizing access to deep financial data without the prohibitive cost or technical overhead typically associated with professional data feeds.
About LayoffAlert
LayoffAlert is a comprehensive tool designed to track mass layoffs and plant closures across the United States, leveraging the official WARN Act notices filed with state governments. Companies in the U.S. with over 100 employees are mandated to file WARN notices at least 60 days prior to executing mass layoffs, ensuring that affected workers receive advance notice. LayoffAlert aggregates and organizes over 6,000 WARN notices from 49 states into a single searchable database, encompassing more than 561,000 affected employees. Users can search by company name, location, industry, or date to find pertinent layoff information before it happens. Additionally, LayoffAlert offers email alerts when new WARN notices are filed for specific companies or regions, ensuring users stay informed. All data is sourced directly from government filings and is updated daily, making LayoffAlert an invaluable resource for those monitoring employer actions, tracking industry trends, or seeking early warnings about potential layoffs. The platform also provides recommendations for financial or legal assistance, catering to the diverse needs of its users.
Frequently Asked Questions
Dividend Data FAQ
How does Dividend Data connect to my spreadsheet?
Dividend Data connects via official add-ins you install from the Google Workspace Marketplace (for Google Sheets) or Microsoft AppSource (for Excel). Once installed, it adds a custom set of functions to your spreadsheet's formula library. You simply type these formulas, like =DIVIDENDDATA_DIVIDENDS("TICKER"), and the add-in handles the data request and population securely in the background, with no coding required.
What is included in the free tier?
The free tier provides 2,500 credits per month that never expire, allowing you to use the spreadsheet functions extensively without a trial period cutoff. This is sufficient for many individual investors to track a portfolio and perform regular analysis. The tier includes access to the core 16+ custom functions for dividends, quotes, ratios, and metrics within the spreadsheet add-ins.
Does it work with both Google Sheets and Microsoft Excel?
Yes, Dividend Data is fully compatible with both major spreadsheet platforms. There is a dedicated Google Sheets add-on and a separate Microsoft Excel add-in. Both offer the same core functionality and formula syntax, allowing you to maintain consistent analysis workflows whether you use Google Workspace or Microsoft 365. The add-ins are independently listed and rated on their respective official stores.
What kind of data history is available?
The platform provides over 30 years of historical market data. This includes historical dividend payments, stock price history, and fundamental financial statement data (annual and quarterly). This deep historical dataset enables long-term trend analysis, backtesting of investment strategies, and the construction of financial models based on extensive historical performance.
LayoffAlert FAQ
What is the WARN Act?
The WARN Act, or Worker Adjustment and Retraining Notification Act, is a U.S. labor law that requires employers to provide advance notice of mass layoffs or plant closures, allowing employees time to prepare for job loss.
How frequently is the data updated?
LayoffAlert updates its database daily, ensuring that users have access to the most current WARN notices and layoff information available.
Can I track multiple companies at once?
Yes, LayoffAlert allows users to track multiple companies or regions simultaneously by setting up customized email alerts for each entity of interest.
Is there a mobile app for LayoffAlert?
As of now, LayoffAlert primarily operates as a web-based platform. However, users can access the site through mobile browsers for on-the-go monitoring.
Alternatives
Dividend Data Alternatives
Dividend Data is a specialized financial data add-on that delivers institutional-grade dividend and fundamental stock metrics directly into spreadsheet cells. It falls into the category of direct spreadsheet integration tools, designed to bypass complex APIs and manual data entry for investors. Users often explore alternatives for several key reasons. These include budget constraints, where subscription costs may not align with individual needs, or specific feature gaps, such as a requirement for different financial metrics, deeper historical data, or compatibility with other analysis platforms like Python or dedicated portfolio software. The need for a different pricing model, like one-time purchase versus subscription, is also a common driver. When evaluating other solutions, focus on core technical compatibility: does it integrate natively with your primary spreadsheet environment (Google Sheets, Excel, or both)? Assess the depth and breadth of the historical financial data offered, the simplicity of the formula or query syntax, and the transparency of the pricing structure. The ideal tool should fit seamlessly into your existing tech stack and workflow without creating new complexities.
LayoffAlert Alternatives
LayoffAlert is a specialized service in the HR & Recruiting category that provides users with timely notifications regarding potential layoffs within their workplaces. By aggregating official WARN Act notices filed by companies across the United States, LayoffAlert offers a comprehensive searchable database that helps employees stay informed and prepared for any changes in their employment status. Users often seek alternatives to LayoffAlert for various reasons, including pricing considerations, specific feature requirements, or compatibility with different platforms. When evaluating alternatives, it's essential to look for services that provide real-time data, user-friendly interfaces, and reliable notifications to ensure you can stay ahead of potential layoffs and make informed decisions regarding your career and finances.