Dividend Data vs Moon Banking
Side-by-side comparison to help you choose the right product.
Dividend Data
Integrate real-time stock data and 30+ years of history directly into your Google Sheets or Excel workflow.
Last updated: March 11, 2026
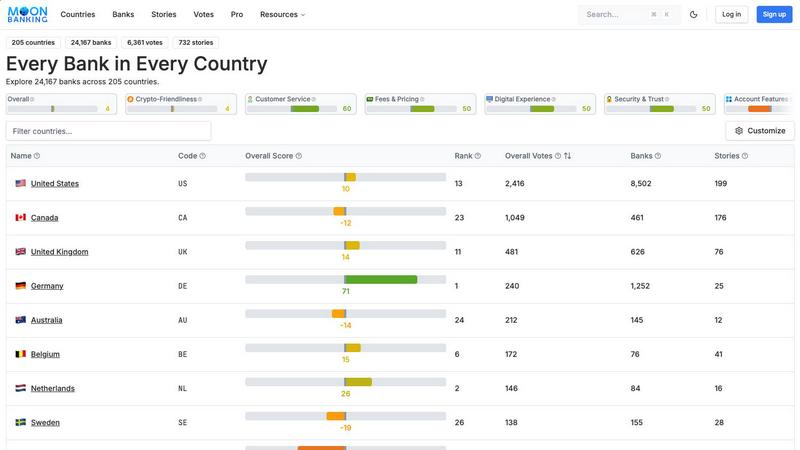
Moon Banking
Unlock global banking insights with Moon Banking's AI-driven dataset of 24,167 banks across 205 countries.
Last updated: February 27, 2026
Visual Comparison
Dividend Data

Moon Banking
Feature Comparison
Dividend Data
Native Spreadsheet Integration
Dividend Data operates through dedicated add-ins for both Google Workspace and Microsoft Excel, embedding itself directly into the spreadsheet's function library. This deep integration allows users to call data using simple formulas like =DIVIDENDDATA_QUOTE("MSFT", "price"), creating a live link between the data source and the spreadsheet cell. It requires no external API key management within the sheet, maintaining a clean and secure user workflow. The add-ins are officially listed and rated on the Google Workspace Marketplace and Microsoft AppSource, ensuring compatibility and trust.
Extensive Financial & Dividend Data Library
The platform provides access to a deep historical database covering over 100 key metrics essential for fundamental analysis. This includes forward and historical dividends, ex-dividend dates, dividend growth rates, full financial statements (income, balance sheet, cash flow), earnings per share, and a wide array of profitability, valuation, and liquidity ratios. With 30+ years of data for 80,000+ tickers, users can perform longitudinal analysis and build robust financial models without sourcing data from multiple, disparate providers.
Formula-Driven Automation Engine
At its core, Dividend Data replaces manual data collection with automated formula functions. Users automate their spreadsheets by writing formulas that reference specific tickers and data points. Once set up, these formulas can refresh to pull in the latest data, ensuring that investment dashboards, screening models, and portfolio trackers remain current without any manual intervention. This feature is pivotal for eliminating the "copy-paste" workflow, reducing errors, and saving significant analytical time.
Multi-Platform Product Ecosystem
Beyond the spreadsheet add-ins, Dividend Data offers a complementary web application, the Dividend Data Terminal. This flagship product provides great data visualizations, AI-powered research tools, and automated portfolio tracking, creating a cohesive ecosystem. The spreadsheet add-ins serve as the data pipeline for quantitative modeling, while the Terminal offers enhanced analytical interfaces, demonstrating the platform's commitment to serving different facets of an investor's workflow across multiple compatible platforms.
Moon Banking
MCP Server Integration
Moon Banking's MCP server directly integrates with popular LLM platforms such as ChatGPT, Claude, Gemini, and Grok. This integration allows users to engage in natural language conversations, making it easier to access global bank data in a user-friendly manner. Financial professionals can effortlessly query information, gaining insights without needing extensive technical knowledge.
OpenClaw Skill
For users employing OpenClaw agents, Moon Banking provides a native skill available on ClawHub, enabling these AI agents to access the Moon Banking API. Through simple curl commands, agents can retrieve bank data efficiently, enhancing their capabilities to serve customer inquiries and process requests, thus streamlining operations.
Developer-First API & SDKs
Moon Banking prioritizes developers by offering modern API solutions and SDKs tailored for the AI economy. These tools are designed to facilitate seamless integration of banking data into various applications, allowing developers to build customized solutions that cater to specific business needs, enhancing overall user experience.
Comprehensive Global Bank Dataset
Housing the largest bank dataset ever created, Moon Banking offers extensive information on thousands of banks across hundreds of countries. This feature ensures that users have access to crucial data, including customer service ratings, fees, pricing, and various banking services, enabling them to make informed comparisons and decisions.
Use Cases
Dividend Data
Automated Dividend Portfolio Tracking
Investors can build a live dividend portfolio tracker within Excel or Google Sheets. By using formulas to pull current prices, dividend yields, and annual payout data for each holding, they can create a dashboard that automatically calculates total portfolio value, projected annual income, and portfolio-level yield. This automates the monitoring process and provides real-time insight into income generation without manual updating.
Dynamic Stock Screening and Analysis
Fundamental investors can construct custom stock screens using the live data functions. For example, a user can build a sheet that screens for stocks with a dividend yield above 3%, a P/E ratio below 20, and a 5-year positive dividend growth rate. By refreshing the sheet, the screen updates with current data, allowing for the rapid identification of new investment opportunities that meet specific, quantitative criteria.
Historical Financial Model Building
Equity researchers and advanced investors can utilize the 30+ years of historical data to build detailed discounted cash flow (DCF) models or conduct trend analyses. They can pull historical revenue, EPS, and free cash flow directly into their model templates to analyze company performance across business cycles, create financial forecasts, and derive intrinsic value estimates based on deep historical datasets.
Educational and Research Modeling
Students, educators, and individual investors learning security analysis can use the tool to pull real-world data into their study models. Instead of working with static, outdated examples, they can build live models that calculate ratios, chart dividend history, or analyze financial statements for any public company, enhancing the practical learning experience with current market data.
Moon Banking
Financial Analysts
Financial analysts can leverage Moon Banking to build AI-powered research tools that uncover unique market opportunities. By utilizing natural language queries, analysts can easily access relevant data to support their market assessments and investment strategies, leading to more informed decision-making.
Bank Marketers
For bank marketers, Moon Banking's vast dataset is invaluable in identifying potential prospects and understanding the competitive landscape. Marketers can analyze market penetration by region and develop targeted outreach strategies using AI-driven insights, ultimately enhancing their marketing effectiveness.
App Developers
App developers can integrate Moon Banking's accurate bank data into their applications, creating features such as comparison tools and finders. This capability enables users to make informed choices when selecting banking services, increasing user engagement and satisfaction within the applications.
International Banking Services
Moon Banking supports international banking operations by providing essential data for banks looking to expand or refine their services in different regions. Users can analyze regional banking trends, customer preferences, and competitive positioning, aiding in the development of effective international strategies.
Overview
About Dividend Data
Dividend Data is a comprehensive financial data integration platform engineered to deliver institutional-grade stock market intelligence directly into the user's native spreadsheet environment. The core product is a suite of add-ins for Google Sheets and Microsoft Excel that eliminates the traditional friction of financial data acquisition. It provides seamless, formula-driven access to over 30 years of historical and real-time data for more than 80,000 global tickers. Designed specifically for dividend and fundamental investors, the system bypasses the need for complex API setups, manual coding, or error-prone copy-paste routines. Users simply employ custom spreadsheet functions, such as =DIVIDENDDATA_DIVIDENDS() or =DIVIDENDDATA_RATIOS(), to pull live data on dividends, yields, payout ratios, financial statements, valuation metrics, and price history directly into their models. Its architecture is built for compatibility and efficiency, offering a generous free tier with 2,500 monthly credits and sub-second average response times. This tech-stack oriented solution empowers investors to build dynamic, automated analysis and portfolio tracking systems within the tools they already use, democratizing access to deep financial data without the prohibitive cost or technical overhead typically associated with professional data feeds.
About Moon Banking
Moon Banking is an innovative AI-powered global banking intelligence platform that fundamentally transforms how financial data is accessed and utilized. By integrating real-time, accurate bank data sourced from the world’s largest bank dataset, Moon Banking eliminates the challenges posed by AI hallucinations, particularly in banking-related inquiries. The platform is designed for a diverse range of users, including financial analysts, bank marketers, and app developers, providing them with unparalleled insights and tools to enhance their operations. With comprehensive information on over 24,167 banks across 205 countries, Moon Banking enables users to make informed decisions and develop targeted strategies. Its robust architecture supports multiple AI integration methods, ensuring that users can access vital banking data seamlessly and efficiently. The main value proposition of Moon Banking lies in its ability to deliver consistent, reliable data while facilitating natural language interactions with AI systems, ultimately empowering users to harness the full potential of banking intelligence.
Frequently Asked Questions
Dividend Data FAQ
How does Dividend Data connect to my spreadsheet?
Dividend Data connects via official add-ins you install from the Google Workspace Marketplace (for Google Sheets) or Microsoft AppSource (for Excel). Once installed, it adds a custom set of functions to your spreadsheet's formula library. You simply type these formulas, like =DIVIDENDDATA_DIVIDENDS("TICKER"), and the add-in handles the data request and population securely in the background, with no coding required.
What is included in the free tier?
The free tier provides 2,500 credits per month that never expire, allowing you to use the spreadsheet functions extensively without a trial period cutoff. This is sufficient for many individual investors to track a portfolio and perform regular analysis. The tier includes access to the core 16+ custom functions for dividends, quotes, ratios, and metrics within the spreadsheet add-ins.
Does it work with both Google Sheets and Microsoft Excel?
Yes, Dividend Data is fully compatible with both major spreadsheet platforms. There is a dedicated Google Sheets add-on and a separate Microsoft Excel add-in. Both offer the same core functionality and formula syntax, allowing you to maintain consistent analysis workflows whether you use Google Workspace or Microsoft 365. The add-ins are independently listed and rated on their respective official stores.
What kind of data history is available?
The platform provides over 30 years of historical market data. This includes historical dividend payments, stock price history, and fundamental financial statement data (annual and quarterly). This deep historical dataset enables long-term trend analysis, backtesting of investment strategies, and the construction of financial models based on extensive historical performance.
Moon Banking FAQ
What kind of data does Moon Banking provide?
Moon Banking offers comprehensive banking data, including customer service ratings, fees, pricing structures, account features, and details about thousands of banks across 205 countries. This data is up-to-date and accessible in real time.
How does the MCP server integration work?
The MCP server allows seamless integration with large language models like ChatGPT, enabling users to engage in natural language conversations to retrieve bank data. This interaction simplifies data access for users, minimizing the need for technical skills.
Can developers create custom applications using Moon Banking data?
Yes, Moon Banking provides modern API solutions and SDKs that allow developers to integrate its banking data into their custom applications. This empowers developers to build tailored solutions that meet specific user needs.
Is Moon Banking suitable for small businesses?
Absolutely. Moon Banking's insights and tools are beneficial for businesses of all sizes, including small businesses seeking to understand their banking options better, identify market opportunities, and enhance their financial strategies.
Alternatives
Dividend Data Alternatives
Dividend Data is a specialized financial data add-on that delivers institutional-grade dividend and fundamental stock metrics directly into spreadsheet cells. It falls into the category of direct spreadsheet integration tools, designed to bypass complex APIs and manual data entry for investors. Users often explore alternatives for several key reasons. These include budget constraints, where subscription costs may not align with individual needs, or specific feature gaps, such as a requirement for different financial metrics, deeper historical data, or compatibility with other analysis platforms like Python or dedicated portfolio software. The need for a different pricing model, like one-time purchase versus subscription, is also a common driver. When evaluating other solutions, focus on core technical compatibility: does it integrate natively with your primary spreadsheet environment (Google Sheets, Excel, or both)? Assess the depth and breadth of the historical financial data offered, the simplicity of the formula or query syntax, and the transparency of the pricing structure. The ideal tool should fit seamlessly into your existing tech stack and workflow without creating new complexities.
Moon Banking Alternatives
Moon Banking is an AI-powered global banking intelligence platform that consolidates the largest dataset of bank information, offering real-time data through advanced integrations like MCP, OpenClaw, and APIs. It caters primarily to financial analysts, marketers, developers, and institutions, providing them with the tools to leverage accurate banking insights for various applications. Users often seek alternatives to Moon Banking due to factors such as pricing, feature sets, or compatibility with existing platforms. When selecting an alternative, it is crucial to consider the comprehensiveness of the bank data provided, the ease of integration with other systems, and the specific needs of your business or project. Look for solutions that offer robust support, customizable features, and a proven track record within the financial data landscape.