Dividend Data vs PipBack
Side-by-side comparison to help you choose the right product.
Dividend Data
Integrate real-time stock data and 30+ years of history directly into your Google Sheets or Excel workflow.
Last updated: March 11, 2026
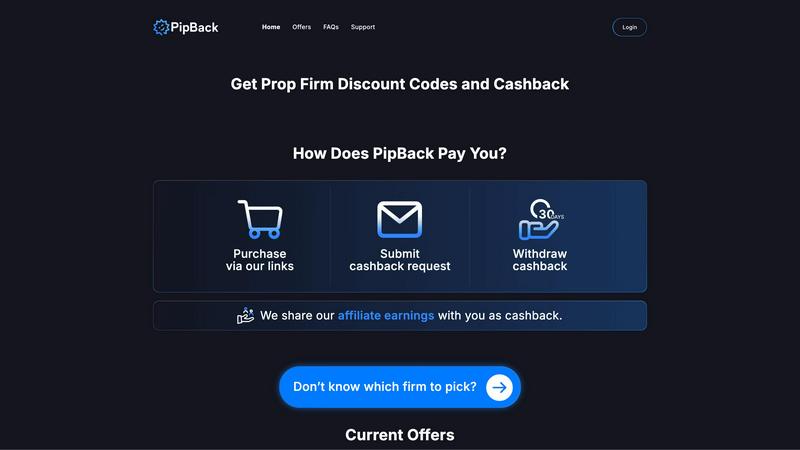
PipBack
PipBack helps prop traders save money with exclusive discount codes and real cashback on trading tools and challenges.
Last updated: February 28, 2026
Visual Comparison
Dividend Data

PipBack
Feature Comparison
Dividend Data
Native Spreadsheet Integration
Dividend Data operates through dedicated add-ins for both Google Workspace and Microsoft Excel, embedding itself directly into the spreadsheet's function library. This deep integration allows users to call data using simple formulas like =DIVIDENDDATA_QUOTE("MSFT", "price"), creating a live link between the data source and the spreadsheet cell. It requires no external API key management within the sheet, maintaining a clean and secure user workflow. The add-ins are officially listed and rated on the Google Workspace Marketplace and Microsoft AppSource, ensuring compatibility and trust.
Extensive Financial & Dividend Data Library
The platform provides access to a deep historical database covering over 100 key metrics essential for fundamental analysis. This includes forward and historical dividends, ex-dividend dates, dividend growth rates, full financial statements (income, balance sheet, cash flow), earnings per share, and a wide array of profitability, valuation, and liquidity ratios. With 30+ years of data for 80,000+ tickers, users can perform longitudinal analysis and build robust financial models without sourcing data from multiple, disparate providers.
Formula-Driven Automation Engine
At its core, Dividend Data replaces manual data collection with automated formula functions. Users automate their spreadsheets by writing formulas that reference specific tickers and data points. Once set up, these formulas can refresh to pull in the latest data, ensuring that investment dashboards, screening models, and portfolio trackers remain current without any manual intervention. This feature is pivotal for eliminating the "copy-paste" workflow, reducing errors, and saving significant analytical time.
Multi-Platform Product Ecosystem
Beyond the spreadsheet add-ins, Dividend Data offers a complementary web application, the Dividend Data Terminal. This flagship product provides great data visualizations, AI-powered research tools, and automated portfolio tracking, creating a cohesive ecosystem. The spreadsheet add-ins serve as the data pipeline for quantitative modeling, while the Terminal offers enhanced analytical interfaces, demonstrating the platform's commitment to serving different facets of an investor's workflow across multiple compatible platforms.
PipBack
Cashback Rewards
PipBack offers users the ability to earn cashback when they purchase prop firm challenges through the platform. This feature allows traders to benefit financially while engaging with various trading opportunities.
Exclusive Discounts
Users can enjoy substantial discounts on trading challenges from partnered prop firms. With discount codes readily available, traders can take advantage of the best deals in the market, enhancing their purchasing power.
User-Friendly Interface
The platform boasts a clean and intuitive interface that simplifies the process of finding and selecting prop firms and trading tools. This streamlined navigation ensures that users can quickly access offers and cashback options without hassle.
Recommendation Tool
PipBack includes a unique recommendation tool that assists users in selecting the prop firm that best suits their trading style and needs. This feature is particularly useful for traders who may be uncertain about which firm to choose.
Use Cases
Dividend Data
Automated Dividend Portfolio Tracking
Investors can build a live dividend portfolio tracker within Excel or Google Sheets. By using formulas to pull current prices, dividend yields, and annual payout data for each holding, they can create a dashboard that automatically calculates total portfolio value, projected annual income, and portfolio-level yield. This automates the monitoring process and provides real-time insight into income generation without manual updating.
Dynamic Stock Screening and Analysis
Fundamental investors can construct custom stock screens using the live data functions. For example, a user can build a sheet that screens for stocks with a dividend yield above 3%, a P/E ratio below 20, and a 5-year positive dividend growth rate. By refreshing the sheet, the screen updates with current data, allowing for the rapid identification of new investment opportunities that meet specific, quantitative criteria.
Historical Financial Model Building
Equity researchers and advanced investors can utilize the 30+ years of historical data to build detailed discounted cash flow (DCF) models or conduct trend analyses. They can pull historical revenue, EPS, and free cash flow directly into their model templates to analyze company performance across business cycles, create financial forecasts, and derive intrinsic value estimates based on deep historical datasets.
Educational and Research Modeling
Students, educators, and individual investors learning security analysis can use the tool to pull real-world data into their study models. Instead of working with static, outdated examples, they can build live models that calculate ratios, chart dividend history, or analyze financial statements for any public company, enhancing the practical learning experience with current market data.
PipBack
Maximizing Trading Budget
Traders can use PipBack to stretch their trading budgets further by leveraging both discounts and cashback. By purchasing challenges at a lower cost, they can allocate more funds to actual trading, enhancing their potential for profits.
Earning While Learning
New traders can benefit from PipBack by participating in prop firm challenges while earning cashback. This allows them to gain valuable trading experience without incurring excessive costs, making it ideal for those just starting.
Targeting Multiple Firms
Experienced traders can utilize PipBack to explore various prop firms and take advantage of different offers. By switching between firms, they can maximize their discounts and cashback, ultimately increasing their overall returns.
Streamlined Cashback Process
Users can easily submit cashback requests after purchases, ensuring a smooth experience. This feature allows traders to quickly access their rewards, creating a seamless integration of savings and earnings.
Overview
About Dividend Data
Dividend Data is a comprehensive financial data integration platform engineered to deliver institutional-grade stock market intelligence directly into the user's native spreadsheet environment. The core product is a suite of add-ins for Google Sheets and Microsoft Excel that eliminates the traditional friction of financial data acquisition. It provides seamless, formula-driven access to over 30 years of historical and real-time data for more than 80,000 global tickers. Designed specifically for dividend and fundamental investors, the system bypasses the need for complex API setups, manual coding, or error-prone copy-paste routines. Users simply employ custom spreadsheet functions, such as =DIVIDENDDATA_DIVIDENDS() or =DIVIDENDDATA_RATIOS(), to pull live data on dividends, yields, payout ratios, financial statements, valuation metrics, and price history directly into their models. Its architecture is built for compatibility and efficiency, offering a generous free tier with 2,500 monthly credits and sub-second average response times. This tech-stack oriented solution empowers investors to build dynamic, automated analysis and portfolio tracking systems within the tools they already use, democratizing access to deep financial data without the prohibitive cost or technical overhead typically associated with professional data feeds.
About PipBack
PipBack is an innovative discount and cashback platform tailored specifically for prop firm traders. It provides a unique opportunity for users to significantly reduce costs associated with trading challenges while simultaneously earning cashback from affiliate revenue. This dual benefit is particularly advantageous for traders who seek to enhance their financial efficiency and trading experience. Designed with a user-friendly interface, PipBack enables traders to easily browse and select from an array of top futures and CFD prop firms, access exclusive discount codes, and submit cashback requests seamlessly. The mission of PipBack is to empower traders to save money and maximize their trading potential. By leveraging the platform, users can not only find the best available deals but also earn rewards, making it an invaluable resource for both novice and seasoned traders aiming to optimize their investments.
Frequently Asked Questions
Dividend Data FAQ
How does Dividend Data connect to my spreadsheet?
Dividend Data connects via official add-ins you install from the Google Workspace Marketplace (for Google Sheets) or Microsoft AppSource (for Excel). Once installed, it adds a custom set of functions to your spreadsheet's formula library. You simply type these formulas, like =DIVIDENDDATA_DIVIDENDS("TICKER"), and the add-in handles the data request and population securely in the background, with no coding required.
What is included in the free tier?
The free tier provides 2,500 credits per month that never expire, allowing you to use the spreadsheet functions extensively without a trial period cutoff. This is sufficient for many individual investors to track a portfolio and perform regular analysis. The tier includes access to the core 16+ custom functions for dividends, quotes, ratios, and metrics within the spreadsheet add-ins.
Does it work with both Google Sheets and Microsoft Excel?
Yes, Dividend Data is fully compatible with both major spreadsheet platforms. There is a dedicated Google Sheets add-on and a separate Microsoft Excel add-in. Both offer the same core functionality and formula syntax, allowing you to maintain consistent analysis workflows whether you use Google Workspace or Microsoft 365. The add-ins are independently listed and rated on their respective official stores.
What kind of data history is available?
The platform provides over 30 years of historical market data. This includes historical dividend payments, stock price history, and fundamental financial statement data (annual and quarterly). This deep historical dataset enables long-term trend analysis, backtesting of investment strategies, and the construction of financial models based on extensive historical performance.
PipBack FAQ
How does PipBack work?
PipBack operates as a discount and cashback platform where users can purchase prop firm challenges at discounted rates. The platform shares affiliate revenue as cashback with users, creating a win-win situation.
What’s the minimum withdrawal amount?
While specific details about the minimum withdrawal amount are not provided, users can typically expect a threshold that aligns with industry standards for cashback programs.
How long till my withdrawal is processed?
The processing time for withdrawals may vary based on payment methods and internal processing times. Users are encouraged to check their account details for estimated timelines.
The prop firm I’m looking for is not among the offers. What should I do?
If a desired prop firm is not listed, users can submit a new partnership request to PipBack. The team continuously seeks to expand their offerings and welcomes user suggestions.
Alternatives
Dividend Data Alternatives
Dividend Data is a specialized financial data add-on that delivers institutional-grade dividend and fundamental stock metrics directly into spreadsheet cells. It falls into the category of direct spreadsheet integration tools, designed to bypass complex APIs and manual data entry for investors. Users often explore alternatives for several key reasons. These include budget constraints, where subscription costs may not align with individual needs, or specific feature gaps, such as a requirement for different financial metrics, deeper historical data, or compatibility with other analysis platforms like Python or dedicated portfolio software. The need for a different pricing model, like one-time purchase versus subscription, is also a common driver. When evaluating other solutions, focus on core technical compatibility: does it integrate natively with your primary spreadsheet environment (Google Sheets, Excel, or both)? Assess the depth and breadth of the historical financial data offered, the simplicity of the formula or query syntax, and the transparency of the pricing structure. The ideal tool should fit seamlessly into your existing tech stack and workflow without creating new complexities.
PipBack Alternatives
PipBack is an innovative platform tailored for prop traders, focusing on delivering substantial discount codes and real cashback on various trading challenges and tools. As a specialized service in the business and finance sector, it enables traders to enhance their financial efficiency while engaging with leading futures and CFD prop firms. However, users often explore alternatives to PipBack due to factors such as pricing, features, and specific platform compatibility needs. When considering alternatives, it is essential to evaluate aspects such as the range of discounts offered, the ease of cashback requests, and the user experience. A robust support system and a straightforward process for accessing offers can also significantly influence the choice of an alternative platform. Ultimately, finding the right fit depends on individual trading strategies and financial goals.