Dividend Data vs Poach
Side-by-side comparison to help you choose the right product.
Dividend Data
Integrate real-time stock data and 30+ years of history directly into your Google Sheets or Excel workflow.
Last updated: March 11, 2026
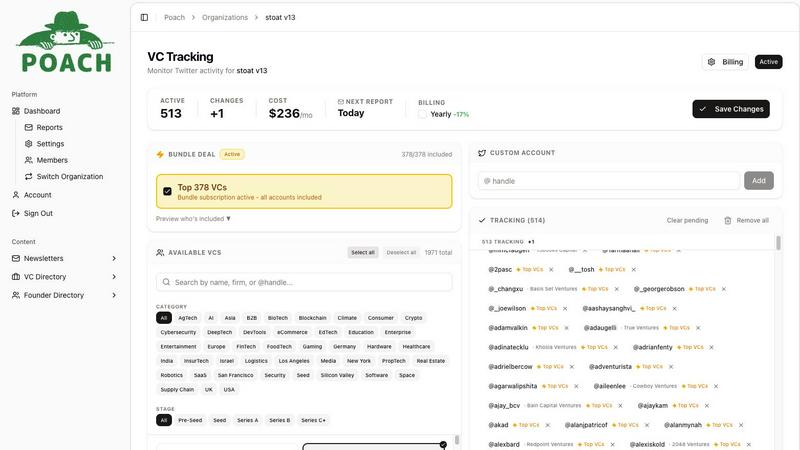
Poach
Poach helps VCs discover promising founders early by tracking competitors and leveraging enriched data from social.
Last updated: February 28, 2026
Visual Comparison
Dividend Data

Poach
Feature Comparison
Dividend Data
Native Spreadsheet Integration
Dividend Data operates through dedicated add-ins for both Google Workspace and Microsoft Excel, embedding itself directly into the spreadsheet's function library. This deep integration allows users to call data using simple formulas like =DIVIDENDDATA_QUOTE("MSFT", "price"), creating a live link between the data source and the spreadsheet cell. It requires no external API key management within the sheet, maintaining a clean and secure user workflow. The add-ins are officially listed and rated on the Google Workspace Marketplace and Microsoft AppSource, ensuring compatibility and trust.
Extensive Financial & Dividend Data Library
The platform provides access to a deep historical database covering over 100 key metrics essential for fundamental analysis. This includes forward and historical dividends, ex-dividend dates, dividend growth rates, full financial statements (income, balance sheet, cash flow), earnings per share, and a wide array of profitability, valuation, and liquidity ratios. With 30+ years of data for 80,000+ tickers, users can perform longitudinal analysis and build robust financial models without sourcing data from multiple, disparate providers.
Formula-Driven Automation Engine
At its core, Dividend Data replaces manual data collection with automated formula functions. Users automate their spreadsheets by writing formulas that reference specific tickers and data points. Once set up, these formulas can refresh to pull in the latest data, ensuring that investment dashboards, screening models, and portfolio trackers remain current without any manual intervention. This feature is pivotal for eliminating the "copy-paste" workflow, reducing errors, and saving significant analytical time.
Multi-Platform Product Ecosystem
Beyond the spreadsheet add-ins, Dividend Data offers a complementary web application, the Dividend Data Terminal. This flagship product provides great data visualizations, AI-powered research tools, and automated portfolio tracking, creating a cohesive ecosystem. The spreadsheet add-ins serve as the data pipeline for quantitative modeling, while the Terminal offers enhanced analytical interfaces, demonstrating the platform's commitment to serving different facets of an investor's workflow across multiple compatible platforms.
Poach
Intelligent VC Tracking
Poach's platform continuously tracks the Twitter followings of top-tier venture capitalists. These follows often indicate early interest in up-and-coming founders, enabling users to discover potential investment opportunities before they become widely known.
LinkedIn Data Enrichment
The platform employs proprietary identity resolution technology to match Twitter accounts with LinkedIn profiles. This enrichment provides users with comprehensive insights into founders' work history and education, giving investors a more complete understanding of their backgrounds.
AI-Powered Labeling
Poach's AI technology analyzes both Twitter and LinkedIn profiles to categorize individuals accurately. Founders, engineers, and investors are labeled accordingly, helping users filter and identify the specific types of talent they wish to engage with.
Customizable Data Delivery
Users can receive enriched data daily directly in their inbox, including executive summaries and CSV exports. The platform allows for extensive filtering options, enabling users to find unfunded founders or any other specific criteria they require effortlessly.
Use Cases
Dividend Data
Automated Dividend Portfolio Tracking
Investors can build a live dividend portfolio tracker within Excel or Google Sheets. By using formulas to pull current prices, dividend yields, and annual payout data for each holding, they can create a dashboard that automatically calculates total portfolio value, projected annual income, and portfolio-level yield. This automates the monitoring process and provides real-time insight into income generation without manual updating.
Dynamic Stock Screening and Analysis
Fundamental investors can construct custom stock screens using the live data functions. For example, a user can build a sheet that screens for stocks with a dividend yield above 3%, a P/E ratio below 20, and a 5-year positive dividend growth rate. By refreshing the sheet, the screen updates with current data, allowing for the rapid identification of new investment opportunities that meet specific, quantitative criteria.
Historical Financial Model Building
Equity researchers and advanced investors can utilize the 30+ years of historical data to build detailed discounted cash flow (DCF) models or conduct trend analyses. They can pull historical revenue, EPS, and free cash flow directly into their model templates to analyze company performance across business cycles, create financial forecasts, and derive intrinsic value estimates based on deep historical datasets.
Educational and Research Modeling
Students, educators, and individual investors learning security analysis can use the tool to pull real-world data into their study models. Instead of working with static, outdated examples, they can build live models that calculate ratios, chart dividend history, or analyze financial statements for any public company, enhancing the practical learning experience with current market data.
Poach
Identifying Early-Stage Founders
Venture capitalists can utilize Poach to uncover early-stage founders who have not yet begun their fundraising journeys. By identifying these individuals earlier, investors can build relationships and secure investment opportunities before the competition.
Enhancing Networking Opportunities
Startup founders can leverage Poach to gain visibility among top investors. By understanding which VCs are following them or engaging with their content, founders can tailor their outreach and increase their chances of securing funding.
Tailored Investment Thesis Development
Investors can use the platform’s advanced filtering options to align their investment strategies with specific types of founders or sectors. This allows for a more strategic approach to building a diverse portfolio that matches their investment thesis.
Data-Driven Decision Making
With Poach's AI-powered insights, venture capital firms can make informed and data-driven decisions regarding which startups to invest in. This reduces the risk associated with sourcing deals and enhances the overall quality of investment opportunities.
Overview
About Dividend Data
Dividend Data is a comprehensive financial data integration platform engineered to deliver institutional-grade stock market intelligence directly into the user's native spreadsheet environment. The core product is a suite of add-ins for Google Sheets and Microsoft Excel that eliminates the traditional friction of financial data acquisition. It provides seamless, formula-driven access to over 30 years of historical and real-time data for more than 80,000 global tickers. Designed specifically for dividend and fundamental investors, the system bypasses the need for complex API setups, manual coding, or error-prone copy-paste routines. Users simply employ custom spreadsheet functions, such as =DIVIDENDDATA_DIVIDENDS() or =DIVIDENDDATA_RATIOS(), to pull live data on dividends, yields, payout ratios, financial statements, valuation metrics, and price history directly into their models. Its architecture is built for compatibility and efficiency, offering a generous free tier with 2,500 monthly credits and sub-second average response times. This tech-stack oriented solution empowers investors to build dynamic, automated analysis and portfolio tracking systems within the tools they already use, democratizing access to deep financial data without the prohibitive cost or technical overhead typically associated with professional data feeds.
About Poach
Poach is a cutting-edge platform tailored for venture capitalists aiming to boost their deal flow by identifying promising early-stage founders on social media before they enter the fundraising phase. By closely monitoring the Twitter activities of leading venture capitalists, Poach can pinpoint entrepreneurs who are on the verge of launching their startups. This proactive approach offers investors a significant edge in an increasingly competitive landscape for startup funding. The platform leverages advanced AI technologies to enrich data from a variety of sources, including LinkedIn, creating detailed profiles of potential founders. This capability enables investors to establish relationships with emerging talent, ensuring they stay ahead of the curve. Whether you are a venture capitalist looking to diversify your portfolio or a startup founder seeking greater visibility, Poach provides invaluable insights that facilitate warm introductions over cold outreach.
Frequently Asked Questions
Dividend Data FAQ
How does Dividend Data connect to my spreadsheet?
Dividend Data connects via official add-ins you install from the Google Workspace Marketplace (for Google Sheets) or Microsoft AppSource (for Excel). Once installed, it adds a custom set of functions to your spreadsheet's formula library. You simply type these formulas, like =DIVIDENDDATA_DIVIDENDS("TICKER"), and the add-in handles the data request and population securely in the background, with no coding required.
What is included in the free tier?
The free tier provides 2,500 credits per month that never expire, allowing you to use the spreadsheet functions extensively without a trial period cutoff. This is sufficient for many individual investors to track a portfolio and perform regular analysis. The tier includes access to the core 16+ custom functions for dividends, quotes, ratios, and metrics within the spreadsheet add-ins.
Does it work with both Google Sheets and Microsoft Excel?
Yes, Dividend Data is fully compatible with both major spreadsheet platforms. There is a dedicated Google Sheets add-on and a separate Microsoft Excel add-in. Both offer the same core functionality and formula syntax, allowing you to maintain consistent analysis workflows whether you use Google Workspace or Microsoft 365. The add-ins are independently listed and rated on their respective official stores.
What kind of data history is available?
The platform provides over 30 years of historical market data. This includes historical dividend payments, stock price history, and fundamental financial statement data (annual and quarterly). This deep historical dataset enables long-term trend analysis, backtesting of investment strategies, and the construction of financial models based on extensive historical performance.
Poach FAQ
How does Poach identify potential founders?
Poach tracks the Twitter followings of top-tier VCs and uses AI to analyze social media activity, ensuring users are informed about promising founders before they raise funds.
What kind of data does Poach provide?
The platform offers enriched profiles that include work history, education, and classification labels, allowing investors to easily identify and filter potential founders based on specific criteria.
Can I integrate Poach with other tools?
Yes, Poach provides API access for seamless integration with other tools and platforms, enabling users to pull data directly into their existing systems for enhanced functionality.
Is there a way to customize the data I receive?
Absolutely, users can customize their data delivery preferences, including daily email summaries and filtered CSV exports tailored to their specific investment needs and criteria.
Alternatives
Dividend Data Alternatives
Dividend Data is a specialized financial data add-on that delivers institutional-grade dividend and fundamental stock metrics directly into spreadsheet cells. It falls into the category of direct spreadsheet integration tools, designed to bypass complex APIs and manual data entry for investors. Users often explore alternatives for several key reasons. These include budget constraints, where subscription costs may not align with individual needs, or specific feature gaps, such as a requirement for different financial metrics, deeper historical data, or compatibility with other analysis platforms like Python or dedicated portfolio software. The need for a different pricing model, like one-time purchase versus subscription, is also a common driver. When evaluating other solutions, focus on core technical compatibility: does it integrate natively with your primary spreadsheet environment (Google Sheets, Excel, or both)? Assess the depth and breadth of the historical financial data offered, the simplicity of the formula or query syntax, and the transparency of the pricing structure. The ideal tool should fit seamlessly into your existing tech stack and workflow without creating new complexities.
Poach Alternatives
Poach is an innovative platform designed to enhance deal flow for venture capitalists by tracking early-stage founders on social media. As a tool that empowers VCs to identify promising entrepreneurs before they embark on their fundraising journeys, Poach stands out in the business and finance category. Users often seek alternatives due to factors like pricing, specific feature sets, or integration capabilities with existing systems. It's essential to look for alternatives that offer similar functionalities, robust data enrichment, and compatibility with other platforms to ensure a seamless user experience and meet unique investment strategies.