Dividend Data vs echoloc
Side-by-side comparison to help you choose the right product.
Dividend Data
Integrate real-time stock data and 30+ years of history directly into your Google Sheets or Excel workflow.
Last updated: March 11, 2026
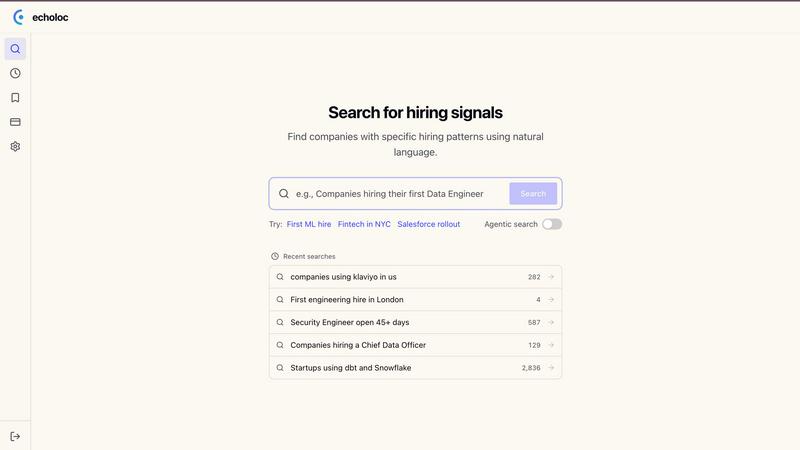
echoloc
Echoloc transforms job posts into actionable insights, revealing buying signals for sales teams to target potential.
Last updated: February 28, 2026
Visual Comparison
Dividend Data

echoloc
Feature Comparison
Dividend Data
Native Spreadsheet Integration
Dividend Data operates through dedicated add-ins for both Google Workspace and Microsoft Excel, embedding itself directly into the spreadsheet's function library. This deep integration allows users to call data using simple formulas like =DIVIDENDDATA_QUOTE("MSFT", "price"), creating a live link between the data source and the spreadsheet cell. It requires no external API key management within the sheet, maintaining a clean and secure user workflow. The add-ins are officially listed and rated on the Google Workspace Marketplace and Microsoft AppSource, ensuring compatibility and trust.
Extensive Financial & Dividend Data Library
The platform provides access to a deep historical database covering over 100 key metrics essential for fundamental analysis. This includes forward and historical dividends, ex-dividend dates, dividend growth rates, full financial statements (income, balance sheet, cash flow), earnings per share, and a wide array of profitability, valuation, and liquidity ratios. With 30+ years of data for 80,000+ tickers, users can perform longitudinal analysis and build robust financial models without sourcing data from multiple, disparate providers.
Formula-Driven Automation Engine
At its core, Dividend Data replaces manual data collection with automated formula functions. Users automate their spreadsheets by writing formulas that reference specific tickers and data points. Once set up, these formulas can refresh to pull in the latest data, ensuring that investment dashboards, screening models, and portfolio trackers remain current without any manual intervention. This feature is pivotal for eliminating the "copy-paste" workflow, reducing errors, and saving significant analytical time.
Multi-Platform Product Ecosystem
Beyond the spreadsheet add-ins, Dividend Data offers a complementary web application, the Dividend Data Terminal. This flagship product provides great data visualizations, AI-powered research tools, and automated portfolio tracking, creating a cohesive ecosystem. The spreadsheet add-ins serve as the data pipeline for quantitative modeling, while the Terminal offers enhanced analytical interfaces, demonstrating the platform's commitment to serving different facets of an investor's workflow across multiple compatible platforms.
echoloc
Real-Time Job Posting Analysis
Echoloc continuously monitors and analyzes over 10 million job postings from more than 30 million companies. This real-time data allows sales professionals to access the latest hiring trends and signals, ensuring they are always informed about potential opportunities in their target markets.
Evidence-Based Results
Every match generated by Echoloc is accompanied by job-post snippets, providing clear and concrete evidence of buyer intent. This eliminates ambiguity, allowing sales teams to confidently tailor their outreach based on real-time, actionable insights.
Easy Search Functionality
With Echoloc's intuitive search interface, users can simply describe what they are looking for in plain English. This eliminates the need for complex filters, enabling sales professionals to quickly find relevant signals, such as companies hiring for specific roles or experiencing hiring spikes.
Competitive Edge Alerts
Echoloc empowers teams to gain a competitive advantage by identifying buyer intent before it becomes mainstream. By catching hiring signals early, sales professionals can engage prospects proactively, ensuring they are not just another name on a traditional intent data list.
Use Cases
Dividend Data
Automated Dividend Portfolio Tracking
Investors can build a live dividend portfolio tracker within Excel or Google Sheets. By using formulas to pull current prices, dividend yields, and annual payout data for each holding, they can create a dashboard that automatically calculates total portfolio value, projected annual income, and portfolio-level yield. This automates the monitoring process and provides real-time insight into income generation without manual updating.
Dynamic Stock Screening and Analysis
Fundamental investors can construct custom stock screens using the live data functions. For example, a user can build a sheet that screens for stocks with a dividend yield above 3%, a P/E ratio below 20, and a 5-year positive dividend growth rate. By refreshing the sheet, the screen updates with current data, allowing for the rapid identification of new investment opportunities that meet specific, quantitative criteria.
Historical Financial Model Building
Equity researchers and advanced investors can utilize the 30+ years of historical data to build detailed discounted cash flow (DCF) models or conduct trend analyses. They can pull historical revenue, EPS, and free cash flow directly into their model templates to analyze company performance across business cycles, create financial forecasts, and derive intrinsic value estimates based on deep historical datasets.
Educational and Research Modeling
Students, educators, and individual investors learning security analysis can use the tool to pull real-world data into their study models. Instead of working with static, outdated examples, they can build live models that calculate ratios, chart dividend history, or analyze financial statements for any public company, enhancing the practical learning experience with current market data.
echoloc
Early Opportunity Identification
Sales teams can leverage Echoloc to identify companies that are hiring for pivotal roles, such as data engineers or sales leads. This early identification allows teams to tailor their outreach and present solutions that align with the imminent needs of these growing organizations.
Targeted Outreach Campaigns
Using insights from Echoloc, sales professionals can create highly targeted outreach campaigns. By understanding the specific roles companies are hiring for, they can craft personalized messages that resonate with potential buyers, improving engagement rates significantly.
Market Trend Analysis
Echoloc provides a comprehensive view of market trends by analyzing hiring patterns across industries. This insight enables sales leaders to adjust their strategies based on emerging needs and growth patterns within specific sectors, ensuring they remain relevant and competitive.
Strategic Resource Allocation
With access to real-time signals from Echoloc, sales and marketing teams can allocate resources more strategically. By focusing efforts on companies demonstrating clear intent to hire, they can maximize their return on investment and enhance overall productivity.
Overview
About Dividend Data
Dividend Data is a comprehensive financial data integration platform engineered to deliver institutional-grade stock market intelligence directly into the user's native spreadsheet environment. The core product is a suite of add-ins for Google Sheets and Microsoft Excel that eliminates the traditional friction of financial data acquisition. It provides seamless, formula-driven access to over 30 years of historical and real-time data for more than 80,000 global tickers. Designed specifically for dividend and fundamental investors, the system bypasses the need for complex API setups, manual coding, or error-prone copy-paste routines. Users simply employ custom spreadsheet functions, such as =DIVIDENDDATA_DIVIDENDS() or =DIVIDENDDATA_RATIOS(), to pull live data on dividends, yields, payout ratios, financial statements, valuation metrics, and price history directly into their models. Its architecture is built for compatibility and efficiency, offering a generous free tier with 2,500 monthly credits and sub-second average response times. This tech-stack oriented solution empowers investors to build dynamic, automated analysis and portfolio tracking systems within the tools they already use, democratizing access to deep financial data without the prohibitive cost or technical overhead typically associated with professional data feeds.
About echoloc
Echoloc is a pioneering platform that redefines how sales professionals discover and connect with potential buyers. By leveraging advanced machine learning algorithms, Echoloc analyzes millions of job postings to unveil hidden buying signals that indicate when companies are poised to invest in new technologies or services. This capability empowers sales development representatives (SDRs), account executives (AEs), and revenue teams to identify lucrative opportunities ahead of traditional intent data providers. For example, a job posting for a first data engineer or an expansion of a sales team signals a company's growth phase, suggesting increased spending on relevant solutions. With Echoloc, sales teams can base their outreach strategies on concrete evidence derived from job descriptions, enabling them to engage prospects in a timely and informed manner. This innovative approach not only enhances targeting accuracy but also allows organizations to stay ahead of competitors by capturing buyer intent before it becomes widely recognized.
Frequently Asked Questions
Dividend Data FAQ
How does Dividend Data connect to my spreadsheet?
Dividend Data connects via official add-ins you install from the Google Workspace Marketplace (for Google Sheets) or Microsoft AppSource (for Excel). Once installed, it adds a custom set of functions to your spreadsheet's formula library. You simply type these formulas, like =DIVIDENDDATA_DIVIDENDS("TICKER"), and the add-in handles the data request and population securely in the background, with no coding required.
What is included in the free tier?
The free tier provides 2,500 credits per month that never expire, allowing you to use the spreadsheet functions extensively without a trial period cutoff. This is sufficient for many individual investors to track a portfolio and perform regular analysis. The tier includes access to the core 16+ custom functions for dividends, quotes, ratios, and metrics within the spreadsheet add-ins.
Does it work with both Google Sheets and Microsoft Excel?
Yes, Dividend Data is fully compatible with both major spreadsheet platforms. There is a dedicated Google Sheets add-on and a separate Microsoft Excel add-in. Both offer the same core functionality and formula syntax, allowing you to maintain consistent analysis workflows whether you use Google Workspace or Microsoft 365. The add-ins are independently listed and rated on their respective official stores.
What kind of data history is available?
The platform provides over 30 years of historical market data. This includes historical dividend payments, stock price history, and fundamental financial statement data (annual and quarterly). This deep historical dataset enables long-term trend analysis, backtesting of investment strategies, and the construction of financial models based on extensive historical performance.
echoloc FAQ
How does Echoloc analyze job postings?
Echoloc employs advanced machine learning algorithms to analyze job postings from a vast array of companies. This analysis identifies hiring signals that indicate when companies are likely to invest in new technologies or services.
What types of signals can I expect from Echoloc?
Users can expect to receive various signals, including first hire indicators, hiring spikes, and positions that suggest urgent business needs. These signals provide sales teams with actionable insights to enhance their outreach efforts.
Is there a demo available for Echoloc?
Yes, Echoloc offers a demo for prospective users to understand how the platform works and to see the real-time insights it can provide. Interested individuals can sign up to experience Echoloc's capabilities firsthand.
Can I export the data from Echoloc?
Absolutely. Echoloc allows users to export the results of their searches, providing the flexibility to integrate insights into their existing sales processes or CRM systems for further analysis and follow-up.
Alternatives
Dividend Data Alternatives
Dividend Data is a specialized financial data add-on that delivers institutional-grade dividend and fundamental stock metrics directly into spreadsheet cells. It falls into the category of direct spreadsheet integration tools, designed to bypass complex APIs and manual data entry for investors. Users often explore alternatives for several key reasons. These include budget constraints, where subscription costs may not align with individual needs, or specific feature gaps, such as a requirement for different financial metrics, deeper historical data, or compatibility with other analysis platforms like Python or dedicated portfolio software. The need for a different pricing model, like one-time purchase versus subscription, is also a common driver. When evaluating other solutions, focus on core technical compatibility: does it integrate natively with your primary spreadsheet environment (Google Sheets, Excel, or both)? Assess the depth and breadth of the historical financial data offered, the simplicity of the formula or query syntax, and the transparency of the pricing structure. The ideal tool should fit seamlessly into your existing tech stack and workflow without creating new complexities.
echoloc Alternatives
Echoloc is an innovative platform that falls within the business and finance category, specifically designed to help sales professionals identify potential buyers by analyzing job postings. By uncovering hidden buying signals, Echoloc empowers sales development representatives (SDRs), account executives (AEs), and revenue teams to target accounts that are likely to make purchases. Users often seek alternatives to Echoloc due to factors such as pricing, specific feature sets, or compatibility requirements with their existing tech stack. When considering an alternative, it’s important to evaluate the platform’s ability to accurately analyze job postings, its integration capabilities with other tools, and whether it aligns with the unique needs of your sales processes.