Dividend Data vs MonsterOps
Side-by-side comparison to help you choose the right product.
Dividend Data
Integrate real-time stock data and 30+ years of history directly into your Google Sheets or Excel workflow.
Last updated: March 11, 2026
MonsterOps
MonsterOps is a comprehensive Business Operating System that enhances strategy, meetings, and accountability for SMBs.
Last updated: March 1, 2026
Visual Comparison
Dividend Data

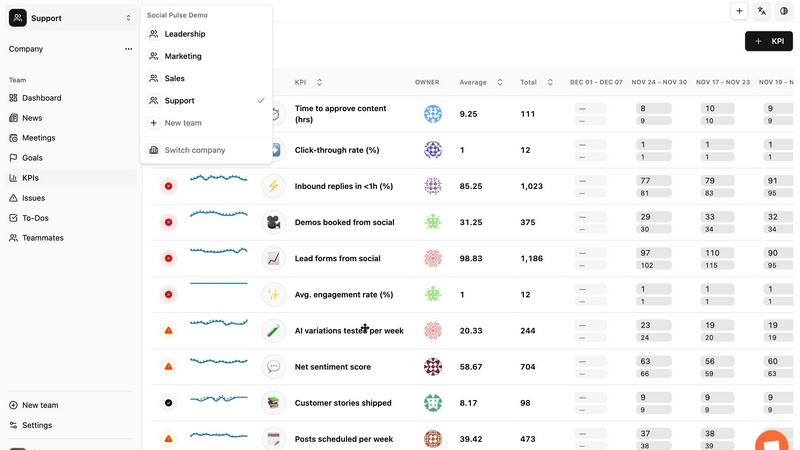
MonsterOps
Feature Comparison
Dividend Data
Native Spreadsheet Integration
Dividend Data operates through dedicated add-ins for both Google Workspace and Microsoft Excel, embedding itself directly into the spreadsheet's function library. This deep integration allows users to call data using simple formulas like =DIVIDENDDATA_QUOTE("MSFT", "price"), creating a live link between the data source and the spreadsheet cell. It requires no external API key management within the sheet, maintaining a clean and secure user workflow. The add-ins are officially listed and rated on the Google Workspace Marketplace and Microsoft AppSource, ensuring compatibility and trust.
Extensive Financial & Dividend Data Library
The platform provides access to a deep historical database covering over 100 key metrics essential for fundamental analysis. This includes forward and historical dividends, ex-dividend dates, dividend growth rates, full financial statements (income, balance sheet, cash flow), earnings per share, and a wide array of profitability, valuation, and liquidity ratios. With 30+ years of data for 80,000+ tickers, users can perform longitudinal analysis and build robust financial models without sourcing data from multiple, disparate providers.
Formula-Driven Automation Engine
At its core, Dividend Data replaces manual data collection with automated formula functions. Users automate their spreadsheets by writing formulas that reference specific tickers and data points. Once set up, these formulas can refresh to pull in the latest data, ensuring that investment dashboards, screening models, and portfolio trackers remain current without any manual intervention. This feature is pivotal for eliminating the "copy-paste" workflow, reducing errors, and saving significant analytical time.
Multi-Platform Product Ecosystem
Beyond the spreadsheet add-ins, Dividend Data offers a complementary web application, the Dividend Data Terminal. This flagship product provides great data visualizations, AI-powered research tools, and automated portfolio tracking, creating a cohesive ecosystem. The spreadsheet add-ins serve as the data pipeline for quantitative modeling, while the Terminal offers enhanced analytical interfaces, demonstrating the platform's commitment to serving different facets of an investor's workflow across multiple compatible platforms.
MonsterOps
Centralized Dashboard
The centralized dashboard of MonsterOps provides an at-a-glance overview of all key metrics and performance indicators. Users can customize their dashboard to display the most relevant data, enabling quick decision-making and effective tracking of business performance.
Real-Time KPI Tracking
MonsterOps features real-time KPI tracking, allowing businesses to monitor their performance metrics continuously. This functionality helps in identifying trends and making informed adjustments to strategies, ensuring that organizations remain agile and responsive to change.
Leadership Meeting Facilitation
The platform includes tools for facilitating leadership meetings, streamlining the process of agenda setting, note-taking, and action item tracking. This feature promotes accountability and ensures that all discussions are productive and focused on achieving business goals.
Task and Project Management
MonsterOps integrates robust task and project management tools, enabling teams to assign tasks, set deadlines, and track progress in one location. This integration reduces the need for multiple applications and enhances collaboration across teams.
Use Cases
Dividend Data
Automated Dividend Portfolio Tracking
Investors can build a live dividend portfolio tracker within Excel or Google Sheets. By using formulas to pull current prices, dividend yields, and annual payout data for each holding, they can create a dashboard that automatically calculates total portfolio value, projected annual income, and portfolio-level yield. This automates the monitoring process and provides real-time insight into income generation without manual updating.
Dynamic Stock Screening and Analysis
Fundamental investors can construct custom stock screens using the live data functions. For example, a user can build a sheet that screens for stocks with a dividend yield above 3%, a P/E ratio below 20, and a 5-year positive dividend growth rate. By refreshing the sheet, the screen updates with current data, allowing for the rapid identification of new investment opportunities that meet specific, quantitative criteria.
Historical Financial Model Building
Equity researchers and advanced investors can utilize the 30+ years of historical data to build detailed discounted cash flow (DCF) models or conduct trend analyses. They can pull historical revenue, EPS, and free cash flow directly into their model templates to analyze company performance across business cycles, create financial forecasts, and derive intrinsic value estimates based on deep historical datasets.
Educational and Research Modeling
Students, educators, and individual investors learning security analysis can use the tool to pull real-world data into their study models. Instead of working with static, outdated examples, they can build live models that calculate ratios, chart dividend history, or analyze financial statements for any public company, enhancing the practical learning experience with current market data.
MonsterOps
Streamlining Operations for Small Businesses
Small businesses can utilize MonsterOps to streamline their operations by centralizing their management tools. This consolidation reduces inefficiencies and enhances productivity, allowing teams to focus on their core functions.
Enhancing Team Collaboration
With its integrated communication and project management features, MonsterOps facilitates better collaboration among team members. This is especially beneficial for remote teams who need a unified platform to coordinate their efforts effectively.
Implementing Business Frameworks
Organizations looking to implement structured business frameworks, such as EOS or OKRs, can leverage MonsterOps to align their teams and track progress. The platform's flexibility allows for easy adaptation to various operating systems.
Monitoring Business Performance
Leadership teams can use MonsterOps to monitor business performance through real-time analytics and KPI tracking. This visibility enables proactive decision-making and helps leaders steer their organizations towards their strategic goals.
Overview
About Dividend Data
Dividend Data is a comprehensive financial data integration platform engineered to deliver institutional-grade stock market intelligence directly into the user's native spreadsheet environment. The core product is a suite of add-ins for Google Sheets and Microsoft Excel that eliminates the traditional friction of financial data acquisition. It provides seamless, formula-driven access to over 30 years of historical and real-time data for more than 80,000 global tickers. Designed specifically for dividend and fundamental investors, the system bypasses the need for complex API setups, manual coding, or error-prone copy-paste routines. Users simply employ custom spreadsheet functions, such as =DIVIDENDDATA_DIVIDENDS() or =DIVIDENDDATA_RATIOS(), to pull live data on dividends, yields, payout ratios, financial statements, valuation metrics, and price history directly into their models. Its architecture is built for compatibility and efficiency, offering a generous free tier with 2,500 monthly credits and sub-second average response times. This tech-stack oriented solution empowers investors to build dynamic, automated analysis and portfolio tracking systems within the tools they already use, democratizing access to deep financial data without the prohibitive cost or technical overhead typically associated with professional data feeds.
About MonsterOps
MonsterOps is an innovative all-in-one Business Operating System (BOS) tailored specifically for small to mid-sized businesses seeking to enhance their operational efficiency. This platform acts as a centralized workspace that integrates various business management tools, effectively streamlining operations and fostering team alignment. By providing a cohesive environment, MonsterOps eliminates the confusion associated with scattered spreadsheets and disparate task applications. This solution is particularly advantageous for organizations implementing frameworks like the Entrepreneurial Operating System (EOS), yet it remains flexible enough to support any business operating system. With features like real-time KPI tracking, leadership meeting facilitation, and a focus on accountability, MonsterOps empowers business owners and leadership teams to shift from reactive problem-solving to proactive management. This transformation ensures that all team members are aligned and working collaboratively toward shared objectives, ultimately driving business success.
Frequently Asked Questions
Dividend Data FAQ
How does Dividend Data connect to my spreadsheet?
Dividend Data connects via official add-ins you install from the Google Workspace Marketplace (for Google Sheets) or Microsoft AppSource (for Excel). Once installed, it adds a custom set of functions to your spreadsheet's formula library. You simply type these formulas, like =DIVIDENDDATA_DIVIDENDS("TICKER"), and the add-in handles the data request and population securely in the background, with no coding required.
What is included in the free tier?
The free tier provides 2,500 credits per month that never expire, allowing you to use the spreadsheet functions extensively without a trial period cutoff. This is sufficient for many individual investors to track a portfolio and perform regular analysis. The tier includes access to the core 16+ custom functions for dividends, quotes, ratios, and metrics within the spreadsheet add-ins.
Does it work with both Google Sheets and Microsoft Excel?
Yes, Dividend Data is fully compatible with both major spreadsheet platforms. There is a dedicated Google Sheets add-on and a separate Microsoft Excel add-in. Both offer the same core functionality and formula syntax, allowing you to maintain consistent analysis workflows whether you use Google Workspace or Microsoft 365. The add-ins are independently listed and rated on their respective official stores.
What kind of data history is available?
The platform provides over 30 years of historical market data. This includes historical dividend payments, stock price history, and fundamental financial statement data (annual and quarterly). This deep historical dataset enables long-term trend analysis, backtesting of investment strategies, and the construction of financial models based on extensive historical performance.
MonsterOps FAQ
What types of businesses can benefit from MonsterOps?
MonsterOps is designed specifically for small to mid-sized businesses, making it ideal for organizations that seek to streamline operations and improve team alignment.
How does MonsterOps support KPI tracking?
MonsterOps offers real-time KPI tracking features that allow businesses to monitor their key performance indicators continuously, facilitating informed decision-making and strategic adjustments.
Can MonsterOps integrate with other tools?
Yes, MonsterOps is designed to integrate seamlessly with various business management tools, allowing organizations to customize their workflows and enhance operational efficiency.
Is training provided for new users of MonsterOps?
MonsterOps offers comprehensive onboarding and training resources to ensure that new users can quickly familiarize themselves with the platform’s features and functionalities, maximizing their investment.
Alternatives
Dividend Data Alternatives
Dividend Data is a specialized financial data add-on that delivers institutional-grade dividend and fundamental stock metrics directly into spreadsheet cells. It falls into the category of direct spreadsheet integration tools, designed to bypass complex APIs and manual data entry for investors. Users often explore alternatives for several key reasons. These include budget constraints, where subscription costs may not align with individual needs, or specific feature gaps, such as a requirement for different financial metrics, deeper historical data, or compatibility with other analysis platforms like Python or dedicated portfolio software. The need for a different pricing model, like one-time purchase versus subscription, is also a common driver. When evaluating other solutions, focus on core technical compatibility: does it integrate natively with your primary spreadsheet environment (Google Sheets, Excel, or both)? Assess the depth and breadth of the historical financial data offered, the simplicity of the formula or query syntax, and the transparency of the pricing structure. The ideal tool should fit seamlessly into your existing tech stack and workflow without creating new complexities.
MonsterOps Alternatives
MonsterOps is an all-in-one Business Operating System (BOS) tailored for small to mid-sized businesses, designed to streamline operations, align teams, and enhance strategy execution. Users often seek alternatives due to factors such as pricing, specific feature requirements, or compatibility with existing platforms. Organizations may look for solutions that offer improved functionality, scalability, or user experience to better suit their unique operational needs. When choosing an alternative to MonsterOps, it's crucial to consider the integration capabilities with your current tech stack, the flexibility of features to accommodate different business frameworks, and the overall user experience. Assessing the level of customer support and community resources can also be beneficial, ensuring that your team can effectively transition to a new platform.