Dividend Data vs Redbark
Side-by-side comparison to help you choose the right product.
Dividend Data
Integrate real-time stock data and 30+ years of history directly into your Google Sheets or Excel workflow.
Last updated: March 11, 2026
Redbark
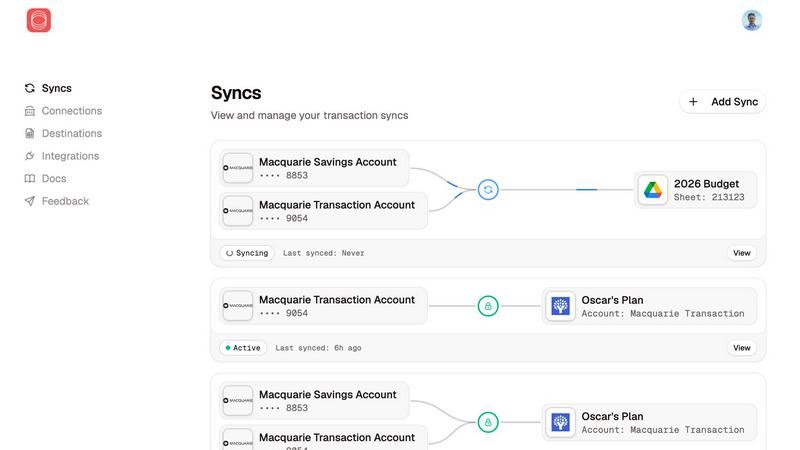
Redbark automates syncing your Australian bank and brokerage data to Google Sheets and YNAB for seamless financial.
Last updated: March 4, 2026
Visual Comparison
Dividend Data

Redbark
Feature Comparison
Dividend Data
Native Spreadsheet Integration
Dividend Data operates through dedicated add-ins for both Google Workspace and Microsoft Excel, embedding itself directly into the spreadsheet's function library. This deep integration allows users to call data using simple formulas like =DIVIDENDDATA_QUOTE("MSFT", "price"), creating a live link between the data source and the spreadsheet cell. It requires no external API key management within the sheet, maintaining a clean and secure user workflow. The add-ins are officially listed and rated on the Google Workspace Marketplace and Microsoft AppSource, ensuring compatibility and trust.
Extensive Financial & Dividend Data Library
The platform provides access to a deep historical database covering over 100 key metrics essential for fundamental analysis. This includes forward and historical dividends, ex-dividend dates, dividend growth rates, full financial statements (income, balance sheet, cash flow), earnings per share, and a wide array of profitability, valuation, and liquidity ratios. With 30+ years of data for 80,000+ tickers, users can perform longitudinal analysis and build robust financial models without sourcing data from multiple, disparate providers.
Formula-Driven Automation Engine
At its core, Dividend Data replaces manual data collection with automated formula functions. Users automate their spreadsheets by writing formulas that reference specific tickers and data points. Once set up, these formulas can refresh to pull in the latest data, ensuring that investment dashboards, screening models, and portfolio trackers remain current without any manual intervention. This feature is pivotal for eliminating the "copy-paste" workflow, reducing errors, and saving significant analytical time.
Multi-Platform Product Ecosystem
Beyond the spreadsheet add-ins, Dividend Data offers a complementary web application, the Dividend Data Terminal. This flagship product provides great data visualizations, AI-powered research tools, and automated portfolio tracking, creating a cohesive ecosystem. The spreadsheet add-ins serve as the data pipeline for quantitative modeling, while the Terminal offers enhanced analytical interfaces, demonstrating the platform's commitment to serving different facets of an investor's workflow across multiple compatible platforms.
Redbark
Real-Time Data Sync
Redbark allows you to connect your Australian bank accounts and synchronize transactions directly to your preferred tools in real-time. This eliminates the need for manual entry and ensures accuracy in your financial tracking.
Multi-Destination Support
With Redbark, you can sync the same bank accounts to multiple destinations such as Google Sheets, YNAB, and Actual Budget simultaneously. Each destination can have its unique formatting, making financial management more flexible.
Smart Deduplication
The platform features intelligent deduplication that uses an ID-based system with overlap buffers to catch late-posting transactions. This means you can rest assured that your data will remain clean and free from duplicate entries.
CDR Compliance and Security
Redbark adheres to the Consumer Data Right framework, ensuring regulated access to your financial data. With AES-256 encryption, your transactions and credentials are securely stored and processed, keeping your information safe and compliant with Australian regulations.
Use Cases
Dividend Data
Automated Dividend Portfolio Tracking
Investors can build a live dividend portfolio tracker within Excel or Google Sheets. By using formulas to pull current prices, dividend yields, and annual payout data for each holding, they can create a dashboard that automatically calculates total portfolio value, projected annual income, and portfolio-level yield. This automates the monitoring process and provides real-time insight into income generation without manual updating.
Dynamic Stock Screening and Analysis
Fundamental investors can construct custom stock screens using the live data functions. For example, a user can build a sheet that screens for stocks with a dividend yield above 3%, a P/E ratio below 20, and a 5-year positive dividend growth rate. By refreshing the sheet, the screen updates with current data, allowing for the rapid identification of new investment opportunities that meet specific, quantitative criteria.
Historical Financial Model Building
Equity researchers and advanced investors can utilize the 30+ years of historical data to build detailed discounted cash flow (DCF) models or conduct trend analyses. They can pull historical revenue, EPS, and free cash flow directly into their model templates to analyze company performance across business cycles, create financial forecasts, and derive intrinsic value estimates based on deep historical datasets.
Educational and Research Modeling
Students, educators, and individual investors learning security analysis can use the tool to pull real-world data into their study models. Instead of working with static, outdated examples, they can build live models that calculate ratios, chart dividend history, or analyze financial statements for any public company, enhancing the practical learning experience with current market data.
Redbark
Freelancers Tracking Invoices
Freelancers can benefit from Redbark by easily syncing their bank transactions to tools like Google Sheets, allowing them to track invoices and cash flow without manual entry, saving them time and reducing errors.
Investors Monitoring Portfolios
Investors can use Redbark to keep a real-time overview of their investment portfolios. By connecting to global brokerages, they can import transaction data directly into their preferred financial management tools.
Small Business Owners Managing Cash Flow
Small business owners can utilize Redbark to automate cash flow management. By syncing bank transactions directly to budgeting tools, they can gain insights into their finances without the hassle of manual data entry.
Individuals Seeking Financial Clarity
Anyone looking for a clearer view of their finances can leverage Redbark to consolidate their financial data. Whether for personal budgeting or investment tracking, the automatic sync feature simplifies financial management.
Overview
About Dividend Data
Dividend Data is a comprehensive financial data integration platform engineered to deliver institutional-grade stock market intelligence directly into the user's native spreadsheet environment. The core product is a suite of add-ins for Google Sheets and Microsoft Excel that eliminates the traditional friction of financial data acquisition. It provides seamless, formula-driven access to over 30 years of historical and real-time data for more than 80,000 global tickers. Designed specifically for dividend and fundamental investors, the system bypasses the need for complex API setups, manual coding, or error-prone copy-paste routines. Users simply employ custom spreadsheet functions, such as =DIVIDENDDATA_DIVIDENDS() or =DIVIDENDDATA_RATIOS(), to pull live data on dividends, yields, payout ratios, financial statements, valuation metrics, and price history directly into their models. Its architecture is built for compatibility and efficiency, offering a generous free tier with 2,500 monthly credits and sub-second average response times. This tech-stack oriented solution empowers investors to build dynamic, automated analysis and portfolio tracking systems within the tools they already use, democratizing access to deep financial data without the prohibitive cost or technical overhead typically associated with professional data feeds.
About Redbark
Redbark is a cutting-edge financial data integration tool designed to bridge the gap between your Australian bank accounts and global investment portfolios. By connecting seamlessly with popular productivity tools like Google Sheets, Notion, and Airtable, Redbark eliminates the cumbersome and error-prone tasks associated with manual data entry and CSV file imports. Utilizing Australia's Consumer Data Right (CDR) framework, Redbark provides a bank-approved, secure method to access transaction, balance, and investment holding data. This ensures that your financial information is synced automatically according to your preferences, flowing directly from your financial institution to your chosen applications without being stored on Redbark's servers. With a focus on simplicity and privacy, Redbark serves freelancers tracking invoices, investors monitoring portfolios, small business owners managing cash flow, and anyone seeking an organized, automated overview of their finances. Setting up Redbark takes just a few minutes, requires no coding skills, and supports a wide array of Australian banks, New Zealand banks via Akahu, and global brokerages through SnapTrade.
Frequently Asked Questions
Dividend Data FAQ
How does Dividend Data connect to my spreadsheet?
Dividend Data connects via official add-ins you install from the Google Workspace Marketplace (for Google Sheets) or Microsoft AppSource (for Excel). Once installed, it adds a custom set of functions to your spreadsheet's formula library. You simply type these formulas, like =DIVIDENDDATA_DIVIDENDS("TICKER"), and the add-in handles the data request and population securely in the background, with no coding required.
What is included in the free tier?
The free tier provides 2,500 credits per month that never expire, allowing you to use the spreadsheet functions extensively without a trial period cutoff. This is sufficient for many individual investors to track a portfolio and perform regular analysis. The tier includes access to the core 16+ custom functions for dividends, quotes, ratios, and metrics within the spreadsheet add-ins.
Does it work with both Google Sheets and Microsoft Excel?
Yes, Dividend Data is fully compatible with both major spreadsheet platforms. There is a dedicated Google Sheets add-on and a separate Microsoft Excel add-in. Both offer the same core functionality and formula syntax, allowing you to maintain consistent analysis workflows whether you use Google Workspace or Microsoft 365. The add-ins are independently listed and rated on their respective official stores.
What kind of data history is available?
The platform provides over 30 years of historical market data. This includes historical dividend payments, stock price history, and fundamental financial statement data (annual and quarterly). This deep historical dataset enables long-term trend analysis, backtesting of investment strategies, and the construction of financial models based on extensive historical performance.
Redbark FAQ
How does Redbark ensure the security of my financial data?
Redbark uses AES-256 encryption to protect all tokens and credentials, ensuring that your financial data remains secure. Additionally, the platform operates under the Australian Consumer Data Right framework, which adds another layer of compliance and security.
Can I connect multiple bank accounts to Redbark?
Yes, Redbark supports multi-account connections. You can sync every type of account—savings, checking, credit cards, and loans—each to its own designated sheet or budgeting tool.
Is Redbark easy to set up?
Absolutely. Setting up Redbark takes just a few minutes, requires no coding knowledge, and provides an intuitive interface for connecting your bank accounts and selecting destinations for your financial data.
What types of financial tools can I integrate with Redbark?
Redbark integrates with a variety of financial tools, including Google Sheets, Notion, YNAB, Actual Budget, and many more. New connections are regularly added to expand your options for data management.
Alternatives
Dividend Data Alternatives
Dividend Data is a specialized financial data add-on that delivers institutional-grade dividend and fundamental stock metrics directly into spreadsheet cells. It falls into the category of direct spreadsheet integration tools, designed to bypass complex APIs and manual data entry for investors. Users often explore alternatives for several key reasons. These include budget constraints, where subscription costs may not align with individual needs, or specific feature gaps, such as a requirement for different financial metrics, deeper historical data, or compatibility with other analysis platforms like Python or dedicated portfolio software. The need for a different pricing model, like one-time purchase versus subscription, is also a common driver. When evaluating other solutions, focus on core technical compatibility: does it integrate natively with your primary spreadsheet environment (Google Sheets, Excel, or both)? Assess the depth and breadth of the historical financial data offered, the simplicity of the formula or query syntax, and the transparency of the pricing structure. The ideal tool should fit seamlessly into your existing tech stack and workflow without creating new complexities.
Redbark Alternatives
Redbark is an innovative financial data synchronization tool designed specifically for users in Australia. It falls under the categories of Business & Finance and Personal Finance, allowing seamless integration between Australian bank accounts and popular productivity applications such as Google Sheets and Notion. Users often seek alternatives to Redbark for various reasons, including pricing concerns, the need for additional features, or specific platform compatibility requirements. When choosing an alternative, it’s essential to consider key factors such as security, ease of use, integration capabilities with existing tools, and the breadth of supported financial institutions. A good alternative should offer a robust and user-friendly experience that meets individual financial management needs without compromising on data privacy.