VolRadar
VolRadar scans 500+ S&P 500 stocks overnight and ranks the best premium-selling setups by volatility edge, so your morning research takes 30 seconds.
Visit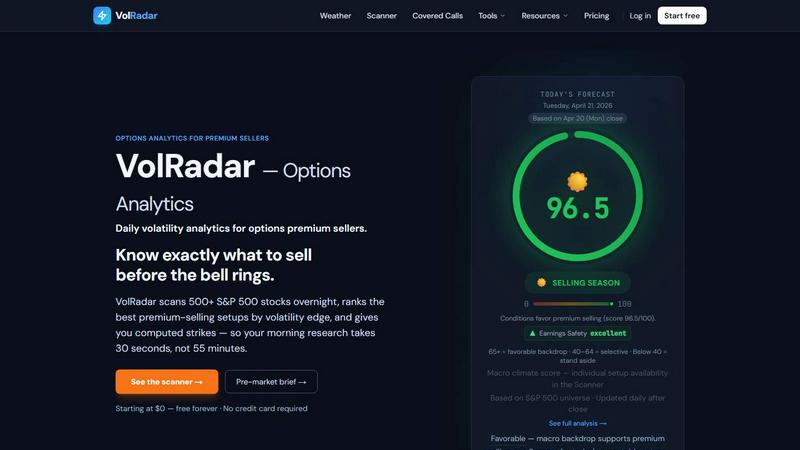
About VolRadar
VolRadar is a daily options analytics platform engineered specifically for premium sellers who trade strategies like iron condors, credit spreads, cash-secured puts, and the wheel on S&P 500 names. The platform solves a critical workflow problem: the time-intensive process of scanning hundreds of tickers each morning to identify the best volatility setups. Every night after the US market close, VolRadar pulls end-of-day options data from ORATS, runs it through proprietary models, and ships a pre-market brief. By the time you sit down with coffee, you already know which tickers are worth selling and which to skip. The core value proposition is speed and precision. VolRadar condenses 500+ stocks into a single Weather Score (0-100) that tells you if today is a good day to sell premium. From there, ranked candidates surface the highest-edge setups, and the Strategy Builder pre-fills strikes with P&L estimates. The platform integrates institutional-grade data from ORATS, CBOE, and S&P 500 indices, ensuring every metric is built on reliable, daily-updated volatility surfaces. For traders who want to stop spending 55 minutes on morning research and start executing in 30 seconds, VolRadar provides the tech stack to make that transition seamless.
Features of VolRadar
Weather Score
The Weather Score is a composite index from 0 to 100 that synthesizes five distinct factors: Premium Edge, VIX level, Volatility Trend, Earnings Safety, and Term Structure. This single number answers the most important question for premium sellers: are conditions favorable today? A score above 65 signals a green light to sell premium broadly across top candidates. Scores between 40 and 64 indicate selective opportunities, while anything below 40 suggests standing aside. The Weather Score is updated daily after the close and includes a 60-day history chart so you can track shifts in market conditions over time.
IV Rank with 252-Day Lookback
VolRadar calculates Implied Volatility (IV) Rank using a 252-day lookback window on 30-day at-the-money implied volatility. This metric tells you where current IV sits relative to its historical range over the past trading year. A high IV Rank (above 70%) indicates that options are expensive relative to recent history, which is the ideal scenario for premium sellers looking to collect inflated premiums. The platform surfaces this metric for every ticker in its 500+ stock universe, allowing you to quickly identify which names have the most attractive volatility pricing.
Volatility Risk Premium (VRP)
The VRP metric measures the difference between 30-day implied volatility and 20-day realized volatility. A positive VRP means options are pricing in more volatility than the stock has actually experienced, creating a structural edge for sellers. VolRadar tracks VRP across all 500+ tickers and highlights stocks with the largest positive spreads. As of the latest data, 479 stocks showed positive VRP, giving sellers a wide universe of candidates. This feature integrates directly with the scanner so you can filter for high-VRP setups exclusively.
Computed Strikes and Strategy Builder
For premium sellers who want to move from analysis to execution fast, VolRadar computes specific strike prices based on either a target delta or a target credit amount. The Strategy Builder pre-fills these strikes for strategies like short puts, iron condors, and covered calls, complete with P&L estimates, breakeven points, and max loss parameters. This eliminates the manual calculation step and ensures every trade is built on consistent, rules-based strike selection. Starter tier subscribers get up to three ranked strategies per ticker.
Use Cases of VolRadar
Morning Pre-Market Briefing
A premium seller wakes up at 6:30 AM and needs to know which positions to enter before the market opens. Instead of scanning 500 tickers manually, they open the VolRadar pre-market brief delivered after the prior day's close. The Weather Score tells them the macro backdrop is favorable (87.7), and the Top 5 Candidates list shows GDDY with an Edge score of 85 and IV Rank of 98%. In under 30 seconds, they know exactly which ticker to analyze further and which to skip.
Earnings Season Rotation
During earnings season, IV tends to spike before announcements and collapse afterward. A trader running the wheel strategy uses VolRadar's Earnings Safety filter and earnings-crush detection to avoid selling premium into names with upcoming earnings events. The platform flags tickers with earnings dates and shows the expected IV collapse post-announcement. This allows the trader to rotate out of pre-earnings positions and into post-earnings names where the volatility crush has already created a favorable selling environment.
Covered Call Optimization
An investor holding a long-term position in AAPL wants to generate additional income through covered calls. They use VolRadar's Covered Call screener to find the optimal strike and expiration that balances premium collection with downside protection. The platform shows IV Rank, VRP, and computed strikes for target deltas, allowing the investor to select a call that collects the most premium while staying within their risk tolerance. The daily update ensures they can adjust strikes as volatility changes.
High IV Stock Screening
A trader specializing in credit spreads needs to find stocks with elevated implied volatility that is likely to revert lower. They open the VolRadar scanner, filter for IV Rank above 70%, and sort by Edge score. The scanner returns 351 high IV stocks as of the latest update, with the top candidates showing Edge scores above 80. The trader then drills into individual ticker reports to confirm VRP is positive and earnings risk is low before building the spread.
Frequently Asked Questions
What data sources does VolRadar use?
VolRadar pulls end-of-day options data from ORATS, a leading provider of institutional-grade options analytics. The platform also integrates data from CBOE and S&P 500 indices to calculate macro-level metrics like the Weather Score. All data is updated daily after the US market close, typically available by 6 PM ET. This combination ensures every metric is built on reliable, accurate volatility surfaces that professional traders trust.
How is the Weather Score calculated?
The Weather Score is a composite index from 0 to 100 that weighs five factors: Premium Edge (how overpriced options are relative to models), VIX level (market fear gauge), Vol Trend (direction of implied volatility), Earnings Safety (proximity to earnings events), and Term Structure (shape of the volatility curve). Each factor is scored and aggregated into a single number. Scores above 65 indicate favorable conditions for selling premium, 40-64 suggest selective opportunities, and below 40 means stand aside.
What strategies does VolRadar support?
VolRadar is designed for premium sellers and supports seven strategy types including iron condors, credit spreads, cash-secured puts, the wheel strategy, covered calls, short puts, and short calls. The platform provides strategy-specific analytics, computed strikes, and P&L estimates for each approach. The Starter tier unlocks up to three ranked strategies per ticker, allowing you to compare different approaches for the same underlying stock.
Can I use VolRadar for free?
Yes, VolRadar offers a free tier that includes the Weather Score, four calculators, and a basic scanner that shows the top 5 candidates. No credit card is required to start. The free tier is designed to give you a daily snapshot of market conditions and the highest-edge setups. For full access to 500+ tickers, computed strikes, the pre-market brief, and weekly trade ideas, the Starter plan is $19 per month.
Similar to VolRadar
iPulse integrates AI-driven market intelligence into your tech stack, delivering automated forecasts, real-time signals, and risk alerts for informed.
TryBit is your crypto payment gateway for accepting over 40 cryptocurrencies with API integration and 0.4% commission.
helpdol is an AI finance tool that uses voice commands to track expenses, forecast cash flow, and organize receipts for independent contractors.
UntilFire securely syncs with 14,000+ financial institutions to calculate your exact date when work becomes optional and shows you the clearest path.
SeasonalVantage integrates seasonal data with options flow screening to identify high-probability trades and confirm smart money moves.
EmLedger unifies multi-entity accounting across all your LLCs and properties with real double-entry and consolidation, replacing per-entity fees with.
Decker is a deliverable OS for consultants, empowering you to build, learn, and monetize high-quality work while accessing expert support.
Invos integrates invoicing, receipt creation, and billing into a seamless dashboard for modern teams to generate professional PDFs instantly.