Dividend Data vs Portfolio Genius
Side-by-side comparison to help you choose the right product.
Dividend Data
Integrate real-time stock data and 30+ years of history directly into your Google Sheets or Excel workflow.
Last updated: March 11, 2026
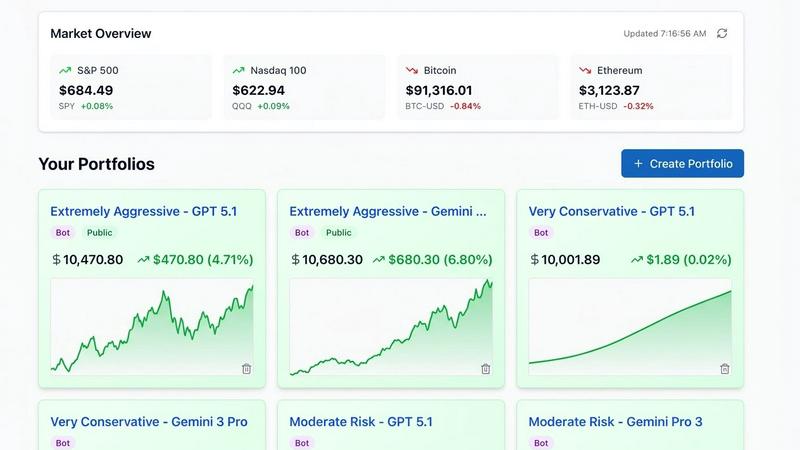
Portfolio Genius
Portfolio Genius integrates AI to analyze markets and manage your trades in real time.
Last updated: March 1, 2026
Visual Comparison
Dividend Data

Portfolio Genius
Feature Comparison
Dividend Data
Native Spreadsheet Integration
Dividend Data operates through dedicated add-ins for both Google Workspace and Microsoft Excel, embedding itself directly into the spreadsheet's function library. This deep integration allows users to call data using simple formulas like =DIVIDENDDATA_QUOTE("MSFT", "price"), creating a live link between the data source and the spreadsheet cell. It requires no external API key management within the sheet, maintaining a clean and secure user workflow. The add-ins are officially listed and rated on the Google Workspace Marketplace and Microsoft AppSource, ensuring compatibility and trust.
Extensive Financial & Dividend Data Library
The platform provides access to a deep historical database covering over 100 key metrics essential for fundamental analysis. This includes forward and historical dividends, ex-dividend dates, dividend growth rates, full financial statements (income, balance sheet, cash flow), earnings per share, and a wide array of profitability, valuation, and liquidity ratios. With 30+ years of data for 80,000+ tickers, users can perform longitudinal analysis and build robust financial models without sourcing data from multiple, disparate providers.
Formula-Driven Automation Engine
At its core, Dividend Data replaces manual data collection with automated formula functions. Users automate their spreadsheets by writing formulas that reference specific tickers and data points. Once set up, these formulas can refresh to pull in the latest data, ensuring that investment dashboards, screening models, and portfolio trackers remain current without any manual intervention. This feature is pivotal for eliminating the "copy-paste" workflow, reducing errors, and saving significant analytical time.
Multi-Platform Product Ecosystem
Beyond the spreadsheet add-ins, Dividend Data offers a complementary web application, the Dividend Data Terminal. This flagship product provides great data visualizations, AI-powered research tools, and automated portfolio tracking, creating a cohesive ecosystem. The spreadsheet add-ins serve as the data pipeline for quantitative modeling, while the Terminal offers enhanced analytical interfaces, demonstrating the platform's commitment to serving different facets of an investor's workflow across multiple compatible platforms.
Portfolio Genius
Multi-Model AI Architecture
Portfolio Genius is built on a flexible, multi-model AI architecture that allows users to select and utilize different large language models (LLMs) for analysis. You can choose between GPT, Claude, or Gemini to generate trade suggestions and insights, enabling you to tailor the AI's analytical style and output to match your specific investment philosophy, whether you prefer aggressive growth strategies or conservative, value-oriented approaches, all through a unified API-driven platform.
Direct Brokerage Integration & Automation
The platform offers deep API-level integration with brokerages like Alpaca, enabling more than just tracking. This connectivity allows for automated trade execution based on AI-generated signals and portfolio rebalancing logic. This feature transforms Portfolio Genius from a passive analyzer into an active management tool, streamlining the workflow for technical users and enabling systematic, emotion-free trading strategies directly from the analytics dashboard.
Real-Time Analytics Engine
Powered by continuous API feeds from global markets, the real-time analytics engine provides live data on stocks, ETFs, and cryptocurrencies. It processes this data alongside financial fundamentals and key metrics to deliver comprehensive performance analytics, risk assessments, and portfolio health dashboards that update instantly, giving traders and investors a mission-critical, up-to-the-moment view of their holdings and market exposure.
AI-Powered News Processing & Sentiment Analysis
This feature continuously scans and processes market news, research reports, and financial publications using natural language processing (NLP). It performs real-time sentiment analysis to detect market-moving events and quantify their potential impact on your specific portfolio holdings. This API-driven news intelligence layer provides a significant edge by contextualizing raw data into actionable insights about emerging risks or opportunities.
Use Cases
Dividend Data
Automated Dividend Portfolio Tracking
Investors can build a live dividend portfolio tracker within Excel or Google Sheets. By using formulas to pull current prices, dividend yields, and annual payout data for each holding, they can create a dashboard that automatically calculates total portfolio value, projected annual income, and portfolio-level yield. This automates the monitoring process and provides real-time insight into income generation without manual updating.
Dynamic Stock Screening and Analysis
Fundamental investors can construct custom stock screens using the live data functions. For example, a user can build a sheet that screens for stocks with a dividend yield above 3%, a P/E ratio below 20, and a 5-year positive dividend growth rate. By refreshing the sheet, the screen updates with current data, allowing for the rapid identification of new investment opportunities that meet specific, quantitative criteria.
Historical Financial Model Building
Equity researchers and advanced investors can utilize the 30+ years of historical data to build detailed discounted cash flow (DCF) models or conduct trend analyses. They can pull historical revenue, EPS, and free cash flow directly into their model templates to analyze company performance across business cycles, create financial forecasts, and derive intrinsic value estimates based on deep historical datasets.
Educational and Research Modeling
Students, educators, and individual investors learning security analysis can use the tool to pull real-world data into their study models. Instead of working with static, outdated examples, they can build live models that calculate ratios, chart dividend history, or analyze financial statements for any public company, enhancing the practical learning experience with current market data.
Portfolio Genius
For the Systematic Trader
Technical traders who rely on data-driven, systematic strategies can use Portfolio Genius to automate their analysis and execution. By configuring the AI models to scan for specific technical or fundamental conditions and connecting via the Alpaca API, they can backtest signals, receive automated alerts, and execute trades directly, creating a seamless, 24/7 trading system that operates on predefined logic without manual intervention.
For the Busy Professional
Individuals with demanding careers who lack the time for daily market monitoring can leverage Portfolio Genius as a fully automated surveillance system. The platform's continuous analysis, AI-driven news monitoring, and scheduled portfolio review reports provide proactive intelligence. They can receive concise, actionable insights and trade suggestions, ensuring their portfolio is being managed according to their strategy even during their busiest periods.
For the Portfolio Optimizer
Investors focused on portfolio construction, diversification, and risk management use Portfolio Genius's analytics to deconstruct their asset allocation. The tool provides visual breakdowns and metrics on sector exposure, correlation, and concentration risk. By using the AI to simulate different portfolio compositions and stress-test them against various market scenarios, users can scientifically optimize their holdings for better risk-adjusted returns.
For the AI & Tech Enthusiast
Developers and tech-savvy investors interested in the practical application of different LLMs in finance use Portfolio Genius to compare outputs from GPT, Claude, and Gemini on the same portfolio data. This allows for experimental strategy development, benchmarking AI performance, and gaining unique, model-specific insights that would be inaccessible through a single-model platform, all within a secure, production-ready environment.
Overview
About Dividend Data
Dividend Data is a comprehensive financial data integration platform engineered to deliver institutional-grade stock market intelligence directly into the user's native spreadsheet environment. The core product is a suite of add-ins for Google Sheets and Microsoft Excel that eliminates the traditional friction of financial data acquisition. It provides seamless, formula-driven access to over 30 years of historical and real-time data for more than 80,000 global tickers. Designed specifically for dividend and fundamental investors, the system bypasses the need for complex API setups, manual coding, or error-prone copy-paste routines. Users simply employ custom spreadsheet functions, such as =DIVIDENDDATA_DIVIDENDS() or =DIVIDENDDATA_RATIOS(), to pull live data on dividends, yields, payout ratios, financial statements, valuation metrics, and price history directly into their models. Its architecture is built for compatibility and efficiency, offering a generous free tier with 2,500 monthly credits and sub-second average response times. This tech-stack oriented solution empowers investors to build dynamic, automated analysis and portfolio tracking systems within the tools they already use, democratizing access to deep financial data without the prohibitive cost or technical overhead typically associated with professional data feeds.
About Portfolio Genius
Portfolio Genius is a sophisticated, API-driven AI portfolio management platform engineered to bridge the gap between institutional-grade analytics and individual investors. It functions as a smart portfolio tracker and management tool, providing continuous, 24/7 analysis of your holdings. The platform's core architecture integrates real-time market data feeds, comprehensive financial fundamentals, and AI-powered news processing to deliver actionable intelligence. Its primary value proposition lies in a unique multi-model AI system that allows users to leverage different large language models (LLMs)—specifically OpenAI's GPT, Anthropic's Claude, or Google's Gemini—to generate trade suggestions and strategic insights tailored to specific investment styles and risk profiles. Built for seamless integration, it offers both a conversational chat interface for natural language queries and direct brokerage API connectivity, such as with Alpaca, for automated trade execution. Designed for a wide technical audience, it serves beginners seeking data-driven guidance, active traders optimizing strategies, and busy professionals requiring automated portfolio surveillance. Security is foundational, with all user data and portfolio information protected by bank-grade encryption within its secure database infrastructure, ensuring enterprise-level protection for sensitive financial data.
Frequently Asked Questions
Dividend Data FAQ
How does Dividend Data connect to my spreadsheet?
Dividend Data connects via official add-ins you install from the Google Workspace Marketplace (for Google Sheets) or Microsoft AppSource (for Excel). Once installed, it adds a custom set of functions to your spreadsheet's formula library. You simply type these formulas, like =DIVIDENDDATA_DIVIDENDS("TICKER"), and the add-in handles the data request and population securely in the background, with no coding required.
What is included in the free tier?
The free tier provides 2,500 credits per month that never expire, allowing you to use the spreadsheet functions extensively without a trial period cutoff. This is sufficient for many individual investors to track a portfolio and perform regular analysis. The tier includes access to the core 16+ custom functions for dividends, quotes, ratios, and metrics within the spreadsheet add-ins.
Does it work with both Google Sheets and Microsoft Excel?
Yes, Dividend Data is fully compatible with both major spreadsheet platforms. There is a dedicated Google Sheets add-on and a separate Microsoft Excel add-in. Both offer the same core functionality and formula syntax, allowing you to maintain consistent analysis workflows whether you use Google Workspace or Microsoft 365. The add-ins are independently listed and rated on their respective official stores.
What kind of data history is available?
The platform provides over 30 years of historical market data. This includes historical dividend payments, stock price history, and fundamental financial statement data (annual and quarterly). This deep historical dataset enables long-term trend analysis, backtesting of investment strategies, and the construction of financial models based on extensive historical performance.
Portfolio Genius FAQ
Does Portfolio Genius provide investment advice?
No. Portfolio Genius is a portfolio tracking and analytics platform that provides educational and informational analysis based on market data and AI processing. It generates trade suggestions and insights for your consideration, but it is not a registered investment advisor. All investment decisions and their outcomes are solely your responsibility. The platform is a tool to enhance your research, not a substitute for personal judgment or professional financial advice.
How does the brokerage integration work?
Portfolio Genius connects to supported brokerages like Alpaca via secure, read-and-write API keys that you provide. This OAuth-based integration allows the platform to pull your real-time holdings and account data for analysis and, with your explicit configuration, can place trades based on AI-generated signals or your instructions. All API credentials are encrypted, and you maintain full control over the level of access and automation enabled.
What makes the multi-model AI feature valuable?
Different large language models have unique strengths in reasoning, data analysis, and content generation. By offering access to GPT, Claude, and Gemini, Portfolio Genius lets you leverage these distinct capabilities. You might use one model for deep fundamental analysis, another for concise executive summaries, or a third for creative scenario planning. This flexibility allows for more nuanced, comprehensive insights than a single-model approach, catering to diverse analytical needs.
Is my financial data secure with Portfolio Genius?
Yes. Security is a foundational pillar of the platform. All data transmission is protected using bank-grade TLS 1.2+ encryption. Your portfolio data and any connected brokerage credentials are stored in an encrypted format within our secure database infrastructure. We employ industry-standard security practices, including strict access controls and regular audits, to ensure your sensitive financial information remains protected at an enterprise level.
Alternatives
Dividend Data Alternatives
Dividend Data is a specialized financial data add-on that delivers institutional-grade dividend and fundamental stock metrics directly into spreadsheet cells. It falls into the category of direct spreadsheet integration tools, designed to bypass complex APIs and manual data entry for investors. Users often explore alternatives for several key reasons. These include budget constraints, where subscription costs may not align with individual needs, or specific feature gaps, such as a requirement for different financial metrics, deeper historical data, or compatibility with other analysis platforms like Python or dedicated portfolio software. The need for a different pricing model, like one-time purchase versus subscription, is also a common driver. When evaluating other solutions, focus on core technical compatibility: does it integrate natively with your primary spreadsheet environment (Google Sheets, Excel, or both)? Assess the depth and breadth of the historical financial data offered, the simplicity of the formula or query syntax, and the transparency of the pricing structure. The ideal tool should fit seamlessly into your existing tech stack and workflow without creating new complexities.
Portfolio Genius Alternatives
Portfolio Genius is an AI-powered investment advisor and portfolio management platform within the fintech and automated trading software category. It distinguishes itself with a multi-model AI architecture, real-time analytics, and direct brokerage API integrations for automated trade execution. Users often explore alternatives for several reasons, including specific budget constraints, the need for compatibility with different brokerages or data sources, or a preference for alternative analytical methodologies beyond its offered LLMs. The search can also be driven by requirements for different user interface paradigms or more specialized reporting tools. When evaluating an alternative, key technical considerations should include the platform's core AI and data stack, its API ecosystem for integrations, the security model for financial data, and the flexibility of its automation rules. The ideal solution should align with your existing technical workflow, preferred broker, and desired level of oversight versus full automation.