Dividend Data vs Tailride
Side-by-side comparison to help you choose the right product.
Dividend Data
Integrate real-time stock data and 30+ years of history directly into your Google Sheets or Excel workflow.
Last updated: March 11, 2026
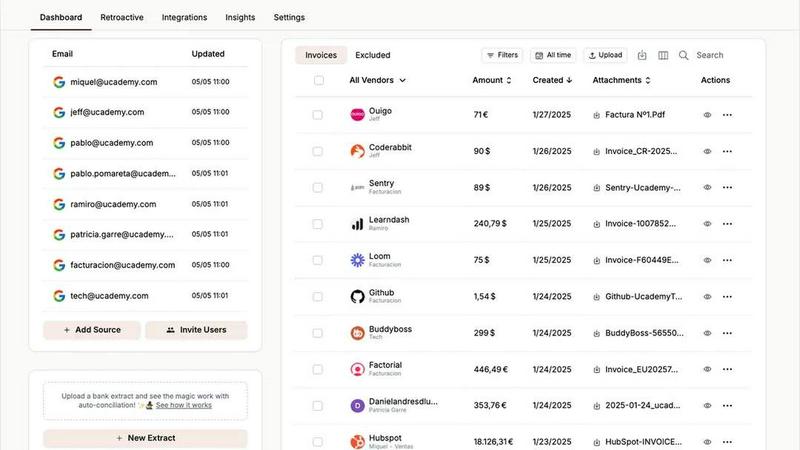
Tailride
Tailride automates invoice and receipt processing directly from your inbox, saving you time and reducing manual work.
Last updated: February 27, 2026
Visual Comparison
Dividend Data

Tailride
Feature Comparison
Dividend Data
Native Spreadsheet Integration
Dividend Data operates through dedicated add-ins for both Google Workspace and Microsoft Excel, embedding itself directly into the spreadsheet's function library. This deep integration allows users to call data using simple formulas like =DIVIDENDDATA_QUOTE("MSFT", "price"), creating a live link between the data source and the spreadsheet cell. It requires no external API key management within the sheet, maintaining a clean and secure user workflow. The add-ins are officially listed and rated on the Google Workspace Marketplace and Microsoft AppSource, ensuring compatibility and trust.
Extensive Financial & Dividend Data Library
The platform provides access to a deep historical database covering over 100 key metrics essential for fundamental analysis. This includes forward and historical dividends, ex-dividend dates, dividend growth rates, full financial statements (income, balance sheet, cash flow), earnings per share, and a wide array of profitability, valuation, and liquidity ratios. With 30+ years of data for 80,000+ tickers, users can perform longitudinal analysis and build robust financial models without sourcing data from multiple, disparate providers.
Formula-Driven Automation Engine
At its core, Dividend Data replaces manual data collection with automated formula functions. Users automate their spreadsheets by writing formulas that reference specific tickers and data points. Once set up, these formulas can refresh to pull in the latest data, ensuring that investment dashboards, screening models, and portfolio trackers remain current without any manual intervention. This feature is pivotal for eliminating the "copy-paste" workflow, reducing errors, and saving significant analytical time.
Multi-Platform Product Ecosystem
Beyond the spreadsheet add-ins, Dividend Data offers a complementary web application, the Dividend Data Terminal. This flagship product provides great data visualizations, AI-powered research tools, and automated portfolio tracking, creating a cohesive ecosystem. The spreadsheet add-ins serve as the data pipeline for quantitative modeling, while the Terminal offers enhanced analytical interfaces, demonstrating the platform's commitment to serving different facets of an investor's workflow across multiple compatible platforms.
Tailride
Inbox Scanning
Tailride's Inbox Scanning feature enables users to find any invoice in their email inbox within seconds. The platform connects directly to your email client, ensuring that no invoice goes unnoticed, whether it's a PDF, image, or embedded in an email body. This feature replaces the need for traditional receipt apps by providing a comprehensive solution that monitors your inbox for incoming invoices.
Online Portals
With the Online Portals feature, Tailride can extract invoices from various websites, making it easier for business owners to manage their accounting needs without the burden of manual tracking. This functionality significantly reduces the time spent on invoice retrieval, allowing users to focus on other critical aspects of their business.
AI Processing
The AI Processing capability of Tailride leverages advanced algorithms to intelligently categorize and manage invoices. Users can set up customizable AI rules tailored to their company's specific needs, ensuring that invoices are automatically classified and organized. This feature reduces the likelihood of human error and enhances overall efficiency in managing financial documents.
Reconciliation
Tailride's Reconciliation feature simplifies the process of matching transactions with invoices. This functionality helps identify any missing documents and ensures that all financial records are accurate and up to date. By automating reconciliation, users can significantly reduce the time spent on manual checks and enhance their accounting accuracy.
Use Cases
Dividend Data
Automated Dividend Portfolio Tracking
Investors can build a live dividend portfolio tracker within Excel or Google Sheets. By using formulas to pull current prices, dividend yields, and annual payout data for each holding, they can create a dashboard that automatically calculates total portfolio value, projected annual income, and portfolio-level yield. This automates the monitoring process and provides real-time insight into income generation without manual updating.
Dynamic Stock Screening and Analysis
Fundamental investors can construct custom stock screens using the live data functions. For example, a user can build a sheet that screens for stocks with a dividend yield above 3%, a P/E ratio below 20, and a 5-year positive dividend growth rate. By refreshing the sheet, the screen updates with current data, allowing for the rapid identification of new investment opportunities that meet specific, quantitative criteria.
Historical Financial Model Building
Equity researchers and advanced investors can utilize the 30+ years of historical data to build detailed discounted cash flow (DCF) models or conduct trend analyses. They can pull historical revenue, EPS, and free cash flow directly into their model templates to analyze company performance across business cycles, create financial forecasts, and derive intrinsic value estimates based on deep historical datasets.
Educational and Research Modeling
Students, educators, and individual investors learning security analysis can use the tool to pull real-world data into their study models. Instead of working with static, outdated examples, they can build live models that calculate ratios, chart dividend history, or analyze financial statements for any public company, enhancing the practical learning experience with current market data.
Tailride
Streamlined Invoice Management
For accountants managing multiple clients, Tailride automates the tedious process of invoice collection. By connecting to client email accounts, accountants can easily extract and organize invoices, ensuring that all financial documents are readily available for review and filing.
Enhanced Financial Oversight
Business owners can utilize Tailride to maintain clear visibility over their expenses. By automatically capturing invoices from various sources, users can track spending patterns and ensure that financial records are accurately up-to-date, ultimately aiding in better decision-making.
Time Savings for Teams
With Tailride, teams can reclaim hundreds of hours each month by eliminating manual data entry and invoice tracking. Employees can focus on more strategic tasks instead of sifting through emails, leading to increased productivity and improved morale.
Improved Expense Reporting
Tailride allows employees to take pictures of physical receipts and send them directly to the platform via messaging apps like Telegram or WhatsApp. This feature enables seamless tracking of expenses, ensuring that all receipts are processed and added to the dashboard for easy reference.
Overview
About Dividend Data
Dividend Data is a comprehensive financial data integration platform engineered to deliver institutional-grade stock market intelligence directly into the user's native spreadsheet environment. The core product is a suite of add-ins for Google Sheets and Microsoft Excel that eliminates the traditional friction of financial data acquisition. It provides seamless, formula-driven access to over 30 years of historical and real-time data for more than 80,000 global tickers. Designed specifically for dividend and fundamental investors, the system bypasses the need for complex API setups, manual coding, or error-prone copy-paste routines. Users simply employ custom spreadsheet functions, such as =DIVIDENDDATA_DIVIDENDS() or =DIVIDENDDATA_RATIOS(), to pull live data on dividends, yields, payout ratios, financial statements, valuation metrics, and price history directly into their models. Its architecture is built for compatibility and efficiency, offering a generous free tier with 2,500 monthly credits and sub-second average response times. This tech-stack oriented solution empowers investors to build dynamic, automated analysis and portfolio tracking systems within the tools they already use, democratizing access to deep financial data without the prohibitive cost or technical overhead typically associated with professional data feeds.
About Tailride
Tailride is an innovative AI-powered accounting automation platform designed to streamline the invoice management process for businesses and accountants alike. By seamlessly connecting to your email inbox, Tailride automatically detects, extracts, and processes invoices and receipts from various email formats and attachments using advanced intelligent document recognition technology. This tool is perfect for busy professionals who need to manage multiple client accounts efficiently. With Tailride, users can extract invoices from over 20 platforms, including Amazon, Meta Ads, and Notion, while employing customizable AI rules for automatic categorization. The platform also integrates effortlessly with popular accounting software like QuickBooks and Xero, along with cloud storage solutions such as Google Drive, ensuring a comprehensive financial management experience. Tailride not only saves time and reduces manual data entry but also offers bank reconciliation features, making it an invaluable asset for accountants and finance teams managing multiple clients and transactions.
Frequently Asked Questions
Dividend Data FAQ
How does Dividend Data connect to my spreadsheet?
Dividend Data connects via official add-ins you install from the Google Workspace Marketplace (for Google Sheets) or Microsoft AppSource (for Excel). Once installed, it adds a custom set of functions to your spreadsheet's formula library. You simply type these formulas, like =DIVIDENDDATA_DIVIDENDS("TICKER"), and the add-in handles the data request and population securely in the background, with no coding required.
What is included in the free tier?
The free tier provides 2,500 credits per month that never expire, allowing you to use the spreadsheet functions extensively without a trial period cutoff. This is sufficient for many individual investors to track a portfolio and perform regular analysis. The tier includes access to the core 16+ custom functions for dividends, quotes, ratios, and metrics within the spreadsheet add-ins.
Does it work with both Google Sheets and Microsoft Excel?
Yes, Dividend Data is fully compatible with both major spreadsheet platforms. There is a dedicated Google Sheets add-on and a separate Microsoft Excel add-in. Both offer the same core functionality and formula syntax, allowing you to maintain consistent analysis workflows whether you use Google Workspace or Microsoft 365. The add-ins are independently listed and rated on their respective official stores.
What kind of data history is available?
The platform provides over 30 years of historical market data. This includes historical dividend payments, stock price history, and fundamental financial statement data (annual and quarterly). This deep historical dataset enables long-term trend analysis, backtesting of investment strategies, and the construction of financial models based on extensive historical performance.
Tailride FAQ
How does Tailride connect to my email inbox?
Tailride connects natively to your email account, allowing it to scan for invoices and receipts directly within your inbox. The platform is compatible with all major email clients, including Gmail, Outlook, and IMAP.
What types of documents can Tailride extract?
Tailride can extract various document types, including PDFs, images, and invoices embedded in email bodies. It processes these documents using intelligent document recognition technology to ensure accurate data capture.
Is there a limit to the number of users I can link to Tailride?
No, Tailride allows you to link as many users as necessary, making it easy for teams to collaborate on expense tracking and invoice management. This feature is particularly beneficial for businesses with multiple employees handling expenses.
How does Tailride help with bank reconciliation?
Tailride's reconciliation feature matches transactions with extracted invoices, helping users identify any discrepancies or missing documents. This automation simplifies the reconciliation process and ensures that financial records remain accurate and reliable.
Alternatives
Dividend Data Alternatives
Dividend Data is a specialized financial data add-on that delivers institutional-grade dividend and fundamental stock metrics directly into spreadsheet cells. It falls into the category of direct spreadsheet integration tools, designed to bypass complex APIs and manual data entry for investors. Users often explore alternatives for several key reasons. These include budget constraints, where subscription costs may not align with individual needs, or specific feature gaps, such as a requirement for different financial metrics, deeper historical data, or compatibility with other analysis platforms like Python or dedicated portfolio software. The need for a different pricing model, like one-time purchase versus subscription, is also a common driver. When evaluating other solutions, focus on core technical compatibility: does it integrate natively with your primary spreadsheet environment (Google Sheets, Excel, or both)? Assess the depth and breadth of the historical financial data offered, the simplicity of the formula or query syntax, and the transparency of the pricing structure. The ideal tool should fit seamlessly into your existing tech stack and workflow without creating new complexities.
Tailride Alternatives
Tailride is an innovative AI-powered accounting automation platform designed to streamline the management of invoices and receipts. By integrating seamlessly with users' email inboxes and web portals, Tailride employs intelligent document recognition to automatically extract and process financial documents, making it an essential tool for businesses looking to enhance their financial workflows. However, users often seek alternatives to Tailride for various reasons, including pricing considerations, specific feature requirements, or compatibility with other platforms. When evaluating alternatives, it is crucial to assess factors such as integration capabilities with existing software, user interface design, customization options, and overall efficiency in processing financial documents. Finding the right solution tailored to your business needs can significantly impact your accounting processes.