
LoadTester
LoadTester runs distributed HTTP and API load tests from your browser or CI/CD pipeline with live analytics and zero infrastructure to manage.
Visit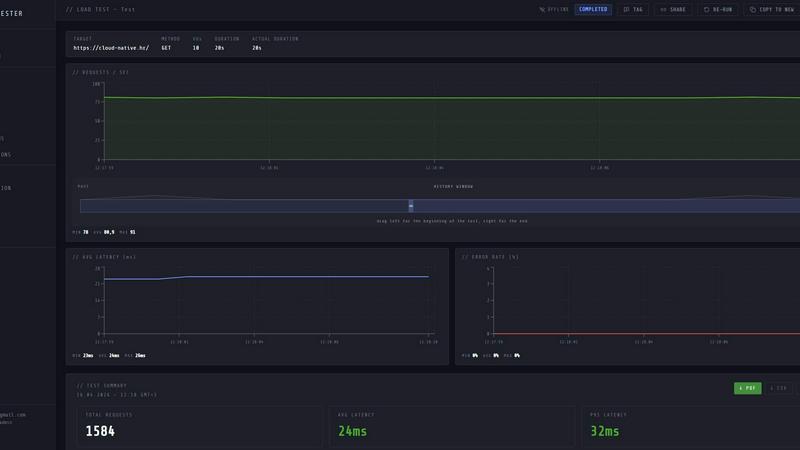
About LoadTester
LoadTester is a modern HTTP and API load testing tool built by Cloud Native d.o.o. for engineering teams that need repeatable performance checks without the overhead of managing infrastructure. It enables developers to run distributed load tests from their browser or CI/CD pipeline, delivering live analytics, p95 and error-rate thresholds, scheduled baselines, and run-to-run comparisons. The platform eliminates the need to provision, configure, or maintain any load testing infrastructure, allowing teams to focus on application performance rather than tooling complexity. LoadTester supports up to 10,000 virtual users and 10,000 requests per second per test, with cold start times under 3 seconds to first request. It is designed for teams that want simple, repeatable performance checks integrated directly into their development workflows. Whether you are testing a single endpoint during development or running a full suite of regression tests before a production release, LoadTester provides the execution engine, telemetry, and guardrails to catch performance regressions before users notice. The platform includes exports in PDF, CSV, and JSON formats, scheduled tests, API access, and workflow integrations for teams that want to embed performance testing into their continuous delivery pipelines. LoadTester is available with a free plan, making it accessible for small teams and individual developers while scaling to enterprise requirements.
Features of LoadTester
Instant Execution, Distributed by Default
Start distributed load tests in seconds without any infrastructure setup, worker orchestration, or scheduling headaches. LoadTester handles worker scaling, infrastructure coordination, and execution flow automatically. Cold start times are under 3 seconds to the first request, with auto-scaling workers that dispatch instantly. The queue time is effectively zero, meaning your tests begin running almost immediately after you hit the start button. This feature removes the painful parts of performance testing setup while keeping the workflows developers actually care about.
Live Analytics and Telemetry
Watch requests, latency, failures, throughput, and bottlenecks in real time while your test is running. LoadTester provides live charts that update during the run, showing throughput, latency, active users, and errors. The telemetry dashboard displays key metrics including RPS, P50, P95, and P99 latency percentiles, along with success rates and error counts. This real-time visibility allows teams to identify performance issues as they happen, rather than waiting for post-run analysis. The latency distribution graph shows the last 60 seconds of data, giving immediate feedback on how the system under test is performing.
Smart Auto-Stop with Thresholds
Set failure or latency thresholds and automatically stop tests when things go sideways. LoadTester allows you to configure guardrails for P95 latency, error rates, and regression comparisons against baselines. When a threshold is breached, the test can auto-stop to prevent wasted resources and alert the team immediately. You can also configure webhooks on completion to post result links to release bots, and set up notifications via Slack and email for regression alerts. This feature ensures that performance testing is not just a data collection exercise but an active part of your quality assurance process.
CI/CD Ready with Integrations
Run tests on every deploy and integrate LoadTester directly into your continuous integration and continuous delivery pipelines. The platform provides API access for programmatic test execution and result retrieval, along with webhooks for triggering actions on test completion. Slack and email alerts keep the team informed about performance regressions and threshold breaches. Scheduled tests allow you to run nightly release gates or hourly performance checks without manual intervention. These integrations make it easy to embed performance testing into existing development workflows, ensuring that every code change is validated against performance requirements.
Use Cases of LoadTester
Pre-Release Performance Regression Testing
Catch performance regressions before users notice by running automated load tests as part of your release pipeline. Before deploying a new version to production, teams can run baseline comparisons against previous test runs to identify latency increases, throughput drops, or error rate spikes. LoadTester provides run-to-run comparisons and regression thresholds that automatically flag performance degradations. This use case is critical for teams deploying frequently who need to ensure that code changes do not negatively impact user experience. The scheduled test feature allows nightly or hourly runs that continuously validate performance against established baselines.
Spike Testing for E-Commerce and High-Traffic Events
Validate that your application can handle sudden traffic spikes during flash sales, product launches, or seasonal events. LoadTester supports both virtual user and requests-per-second modes, allowing teams to simulate realistic traffic patterns. With support for up to 10,000 virtual users and 10,000 requests per second, you can push your infrastructure to its limits and identify bottlenecks before they impact real customers. The live analytics dashboard shows real-time RPS, latency percentiles, and error rates, giving immediate feedback on how your system handles the load. Auto-stop thresholds prevent runaway tests from overwhelming your infrastructure.
API Endpoint Performance Validation
Test individual API endpoints to ensure they meet latency and throughput Service Level Objectives (SLOs). LoadTester supports GET, POST, PUT, and DELETE methods, allowing comprehensive testing of RESTful APIs. Teams can set specific thresholds for each endpoint, such as P95 latency under 400ms and error rates below 2%. The detailed results include total requests, average latency, P95, data sent, and data received, providing the numbers needed to validate API performance. This use case is essential for microservices architectures where each service must meet its own performance guarantees.
Continuous Performance Monitoring in CI/CD
Integrate performance testing directly into your CI/CD pipeline to catch regressions on every commit. LoadTester provides API access for triggering tests programmatically, along with webhooks for integrating results into your existing toolchain. Teams can configure tests to run automatically after each deployment, with results compared against historical baselines. Slack and email notifications alert the team immediately when performance thresholds are breached. This use case enables a shift-left approach to performance testing, catching issues early in the development cycle when they are cheaper and easier to fix.
Frequently Asked Questions
How does LoadTester handle infrastructure and scaling?
LoadTester is a fully managed platform that handles all infrastructure provisioning and scaling automatically. When you start a test, workers are dispatched in under 3 seconds, and the platform auto-scales to match your test configuration. You do not need to provision any servers, configure load generators, or manage worker orchestration. The system handles distributed execution across multiple workers, infrastructure coordination, and execution flow, allowing you to focus entirely on your test scenarios and results.
What types of tests can I run with LoadTester?
LoadTester supports HTTP and API load testing for GET, POST, PUT, and DELETE methods. You can run tests in either virtual user (VU) mode or requests-per-second (RPS) mode, depending on your testing needs. The platform supports up to 10,000 virtual users and 10,000 requests per second per test. You can configure test duration, rate, and thresholds for auto-stop. Tests can be run ad-hoc from the browser, scheduled for automated execution, or triggered via API from your CI/CD pipeline.
How does LoadTester compare to open-source tools like k6 or Locust?
LoadTester removes the infrastructure management overhead required by open-source tools. With k6 or Locust, you need to provision servers, configure load generators, manage scaling, and handle result storage. LoadTester handles all of this automatically, with instant execution, distributed workers, and built-in result storage and comparison. It also provides a browser-based UI for creating and monitoring tests, live analytics, threshold-based auto-stop, and integrations with Slack, email, and CI/CD pipelines. For teams that want simple, repeatable performance checks without managing infrastructure, LoadTester offers a more streamlined experience.
What happens when a test breaches a configured threshold?
When a test breaches a configured threshold, LoadTester can automatically stop the test to prevent wasted resources and infrastructure overload. You can configure thresholds for P95 latency, error rate, and regression comparison against baselines. When a threshold is breached, the platform triggers notifications via Slack and email, and can send webhooks to your release bot or CI/CD system. The test results are still saved and available for review, allowing your team to analyze exactly what went wrong and take corrective action.
Pricing of LoadTester
LoadTester offers a free plan that is available immediately. For detailed pricing information on paid plans, including limits and features, you can visit the pricing page on the LoadTester website. The free plan allows teams to start running performance tests without any upfront commitment, making it accessible for small teams and individual developers.
Similar to LoadTester


Pay-as-you-go e-signature API and no-code sending. €0.049 per envelope, no monthly minimums, legally valid in 55+ countries.

Free, private image conversion tools that run entirely in your browser.

Ornold MCP lets AI agents control Chromium and antidetect browsers: click, type, read screens, record workflows, replay profiles without scripts.


Managed remote build cache for Nx, Lerna, Turbo, Gradle, and Bazel. Reuse artifacts across CI and developer machines.

AIQualityHQ is a free browser-based tool that instantly checks your AI prompts for structure, safety, privacy, and accuracy with zero server tracking.